AUD/USD
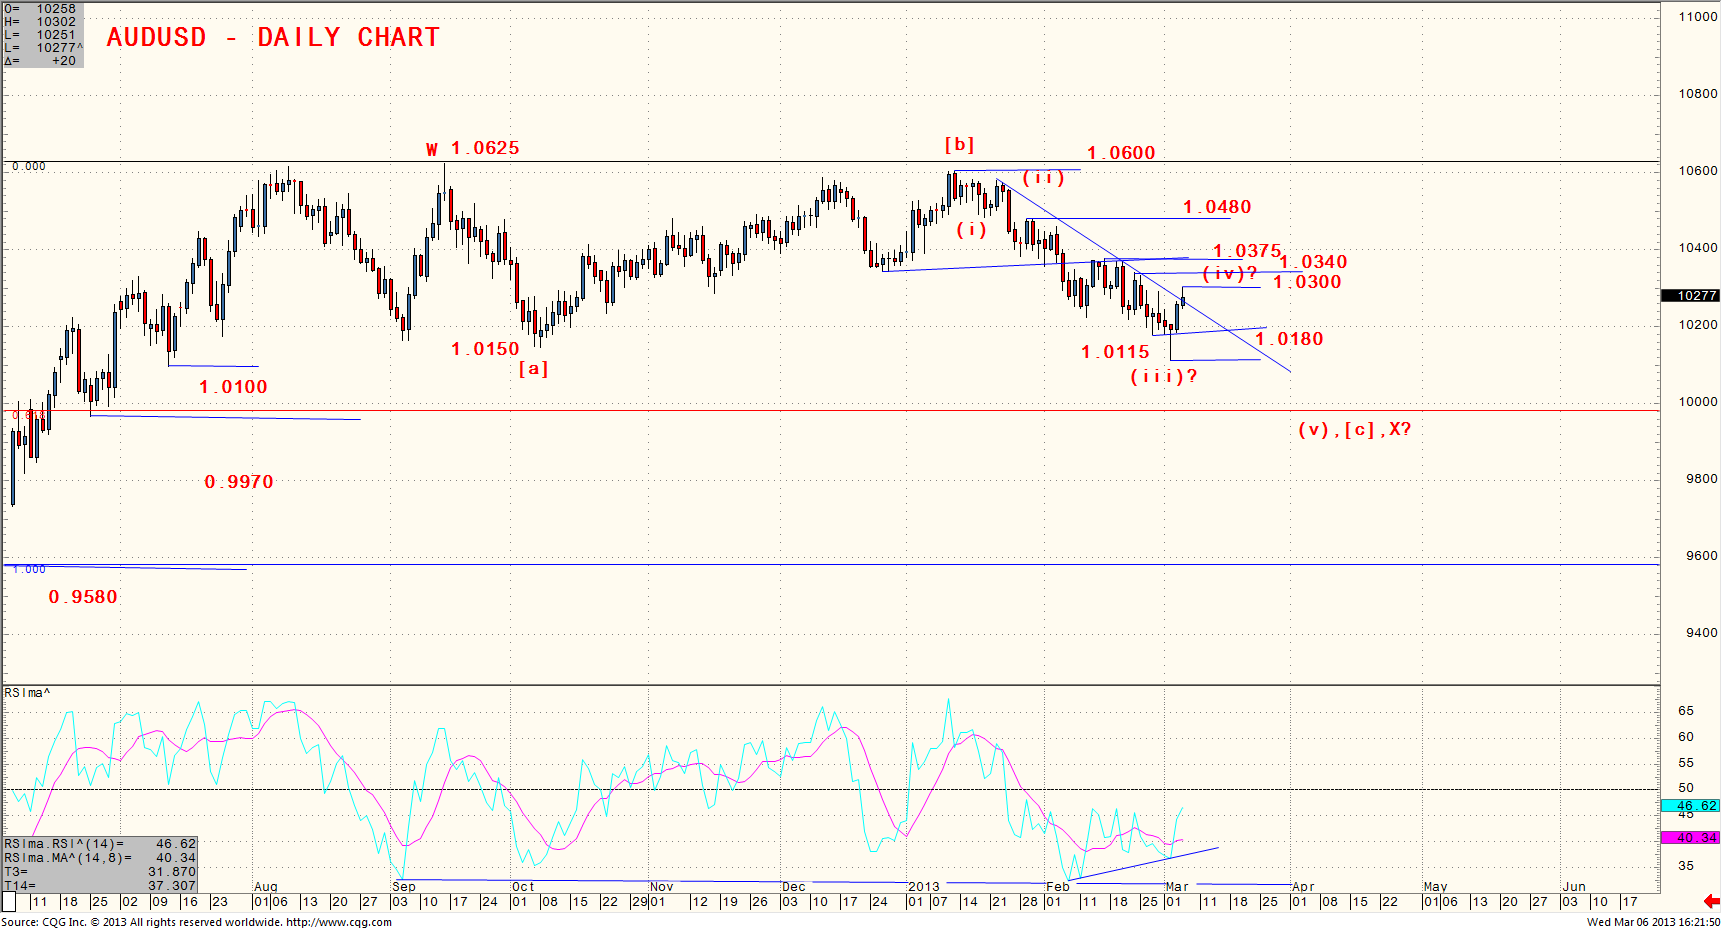
Technical View -
AUD/USD has been trapped in a large range trading since registering July ’11 high at 1.1085. We believe that the pair could attempt another push toward 1.0860/1.1085 while it holds above 0.9970/0.9580 in the medium term. A break below 0.9580/0.9390 however negates the view. Short term correction from 1.0625 is set to test the 1.0100/0.9970 support in a flat wave. A break below however would deepen the correction. A reversal above 1.0375/1.0480 is needed to renew bulls.
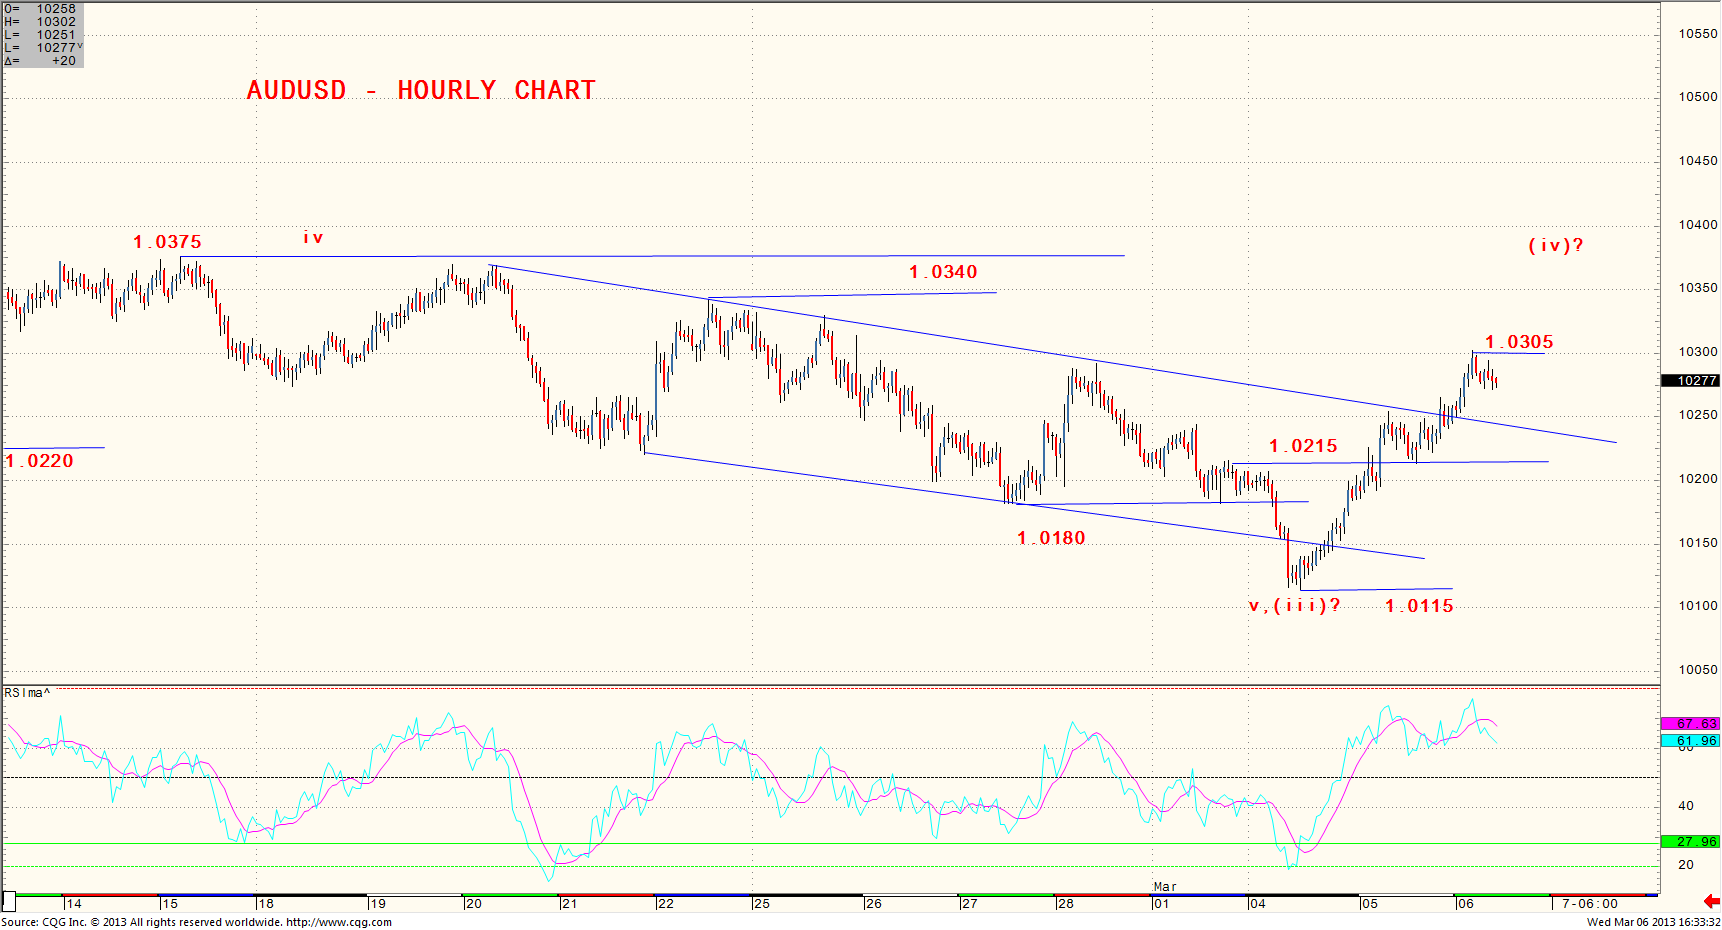
The pair has made a wave (iii) low at 1.0115 with a daily hammer candle. The wave (iv) corrective rally has the potential to test the tough 1.0340/1.0375 resistance before failing. The 1.0215/1.0180 support looks to hold now. A reversal below 1.0180/1.0115 however would expose 1.000/0.9970 (61.8% retracement level is also closer at 0.9980).
Trading Strategy - Look for swing trade longs on weakness.
NZD/USD
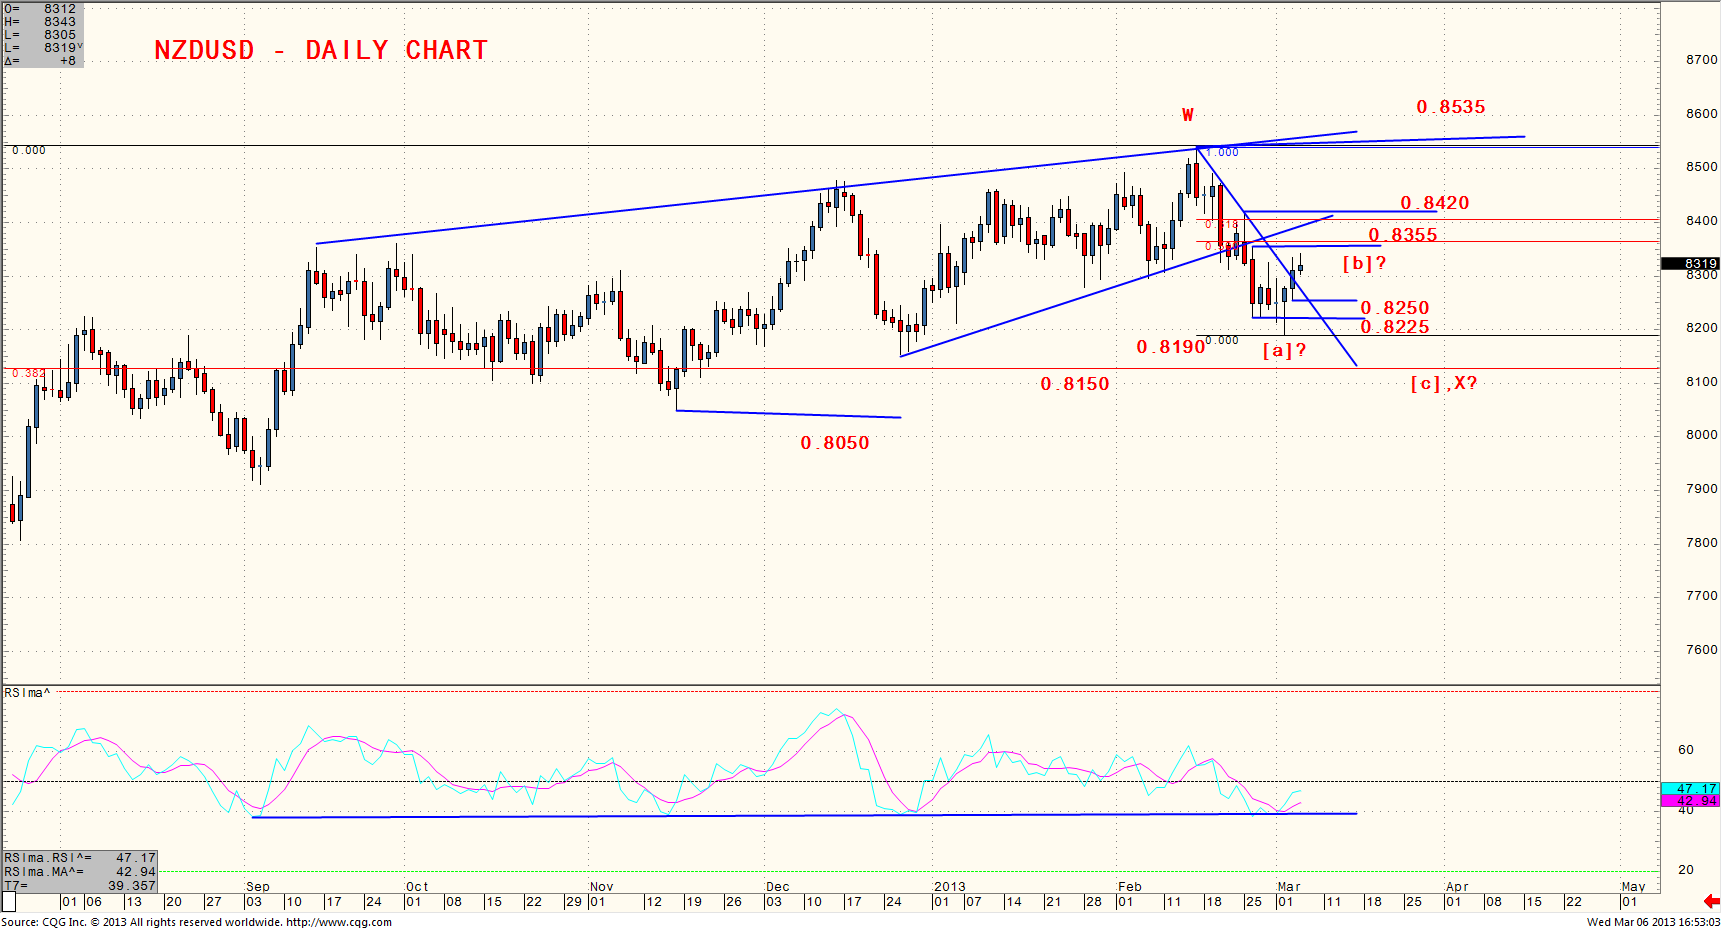
Technical View - The key August ’11 swing high at 0.8845 is likely to be retested if the pair holds above 0.7915/0.7450 on multi-month basis. The setback from 0.8535 may be a wave X which has the potential to test the 0.8150/0.8050 support (Deeper targets are at 0.7915/0.7810). A reversal above 0.8420/0.8535 however would renew bulls.
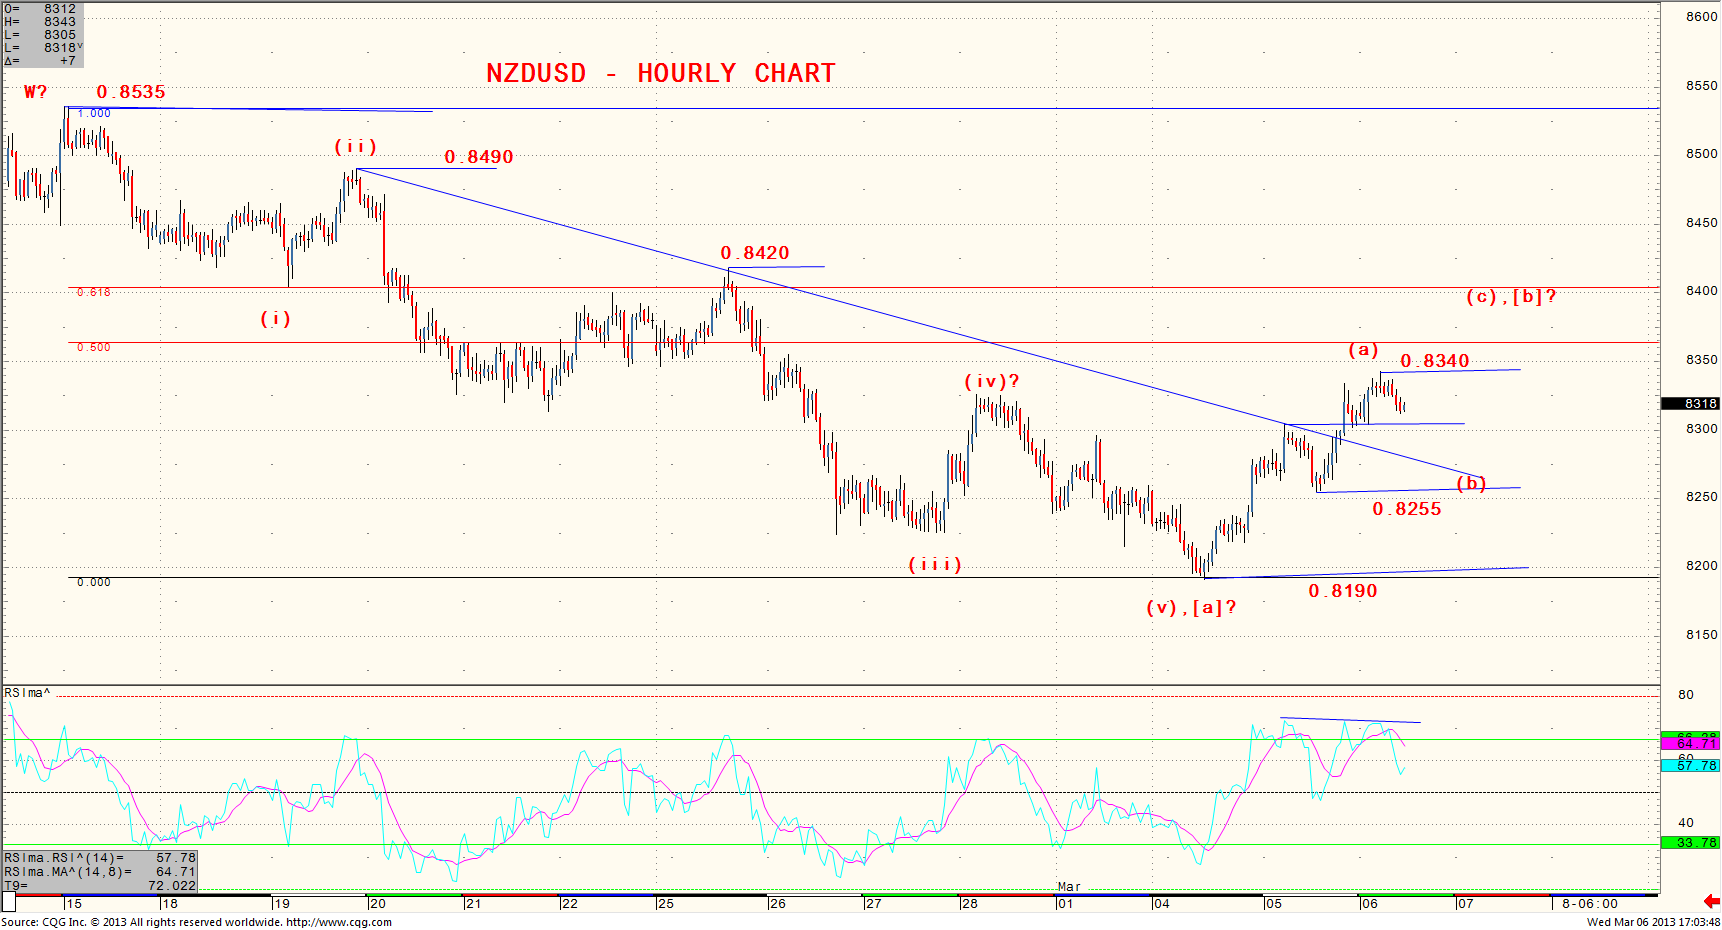
A wave [b] recovery is underway from 0.8190. The corrective swing could test the 0.8355/0.8420 resistance before failing (watch the broken wedge line in daily chart). Immediate term weakness may hold above 0.8260/0.8220. A reversal below 0.8190 however renews bears for 0.8150/0.8050 next.
Trading Strategy - Look for swing long trade around 0.8260.
USD/CAD
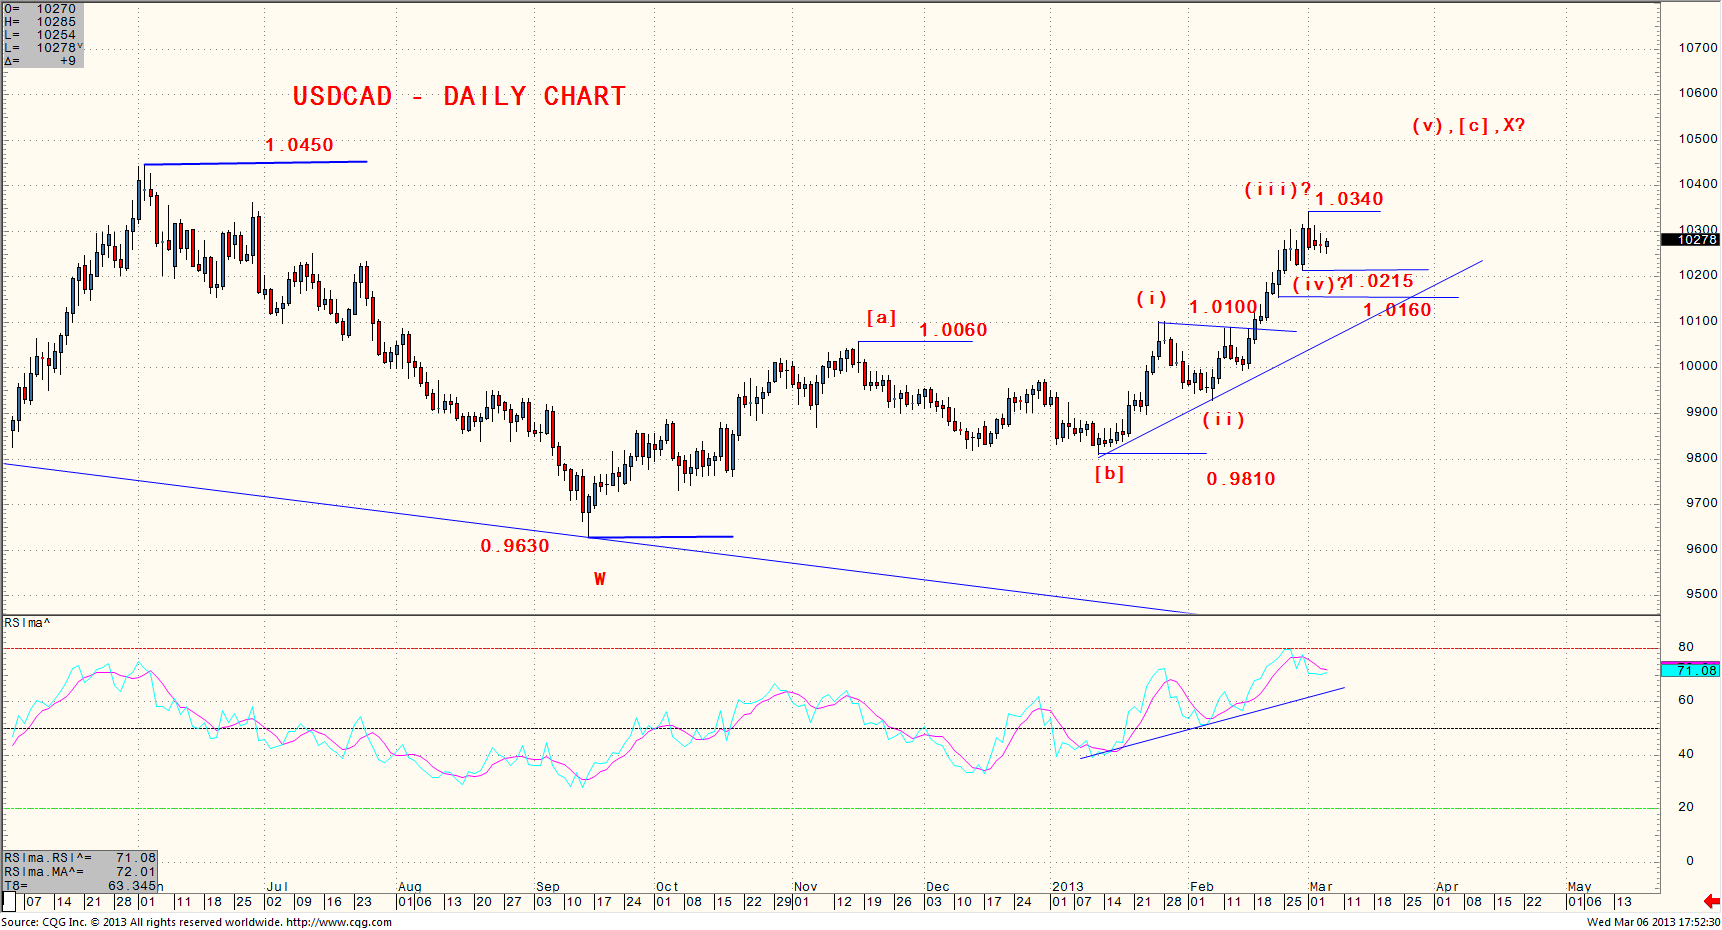
Technical View - We view that the pair’s multi-week uptrend from 0.9630 (Sep’12 low) is corrective and it could test the 1.0450/1.0525 resistance before reversing (Key risk level for the view is 1.0660). A reversal below 1.0160/1.0100 would renew bears for 0.9810/0.9630 initially ahead of key swing low at 0.9405.
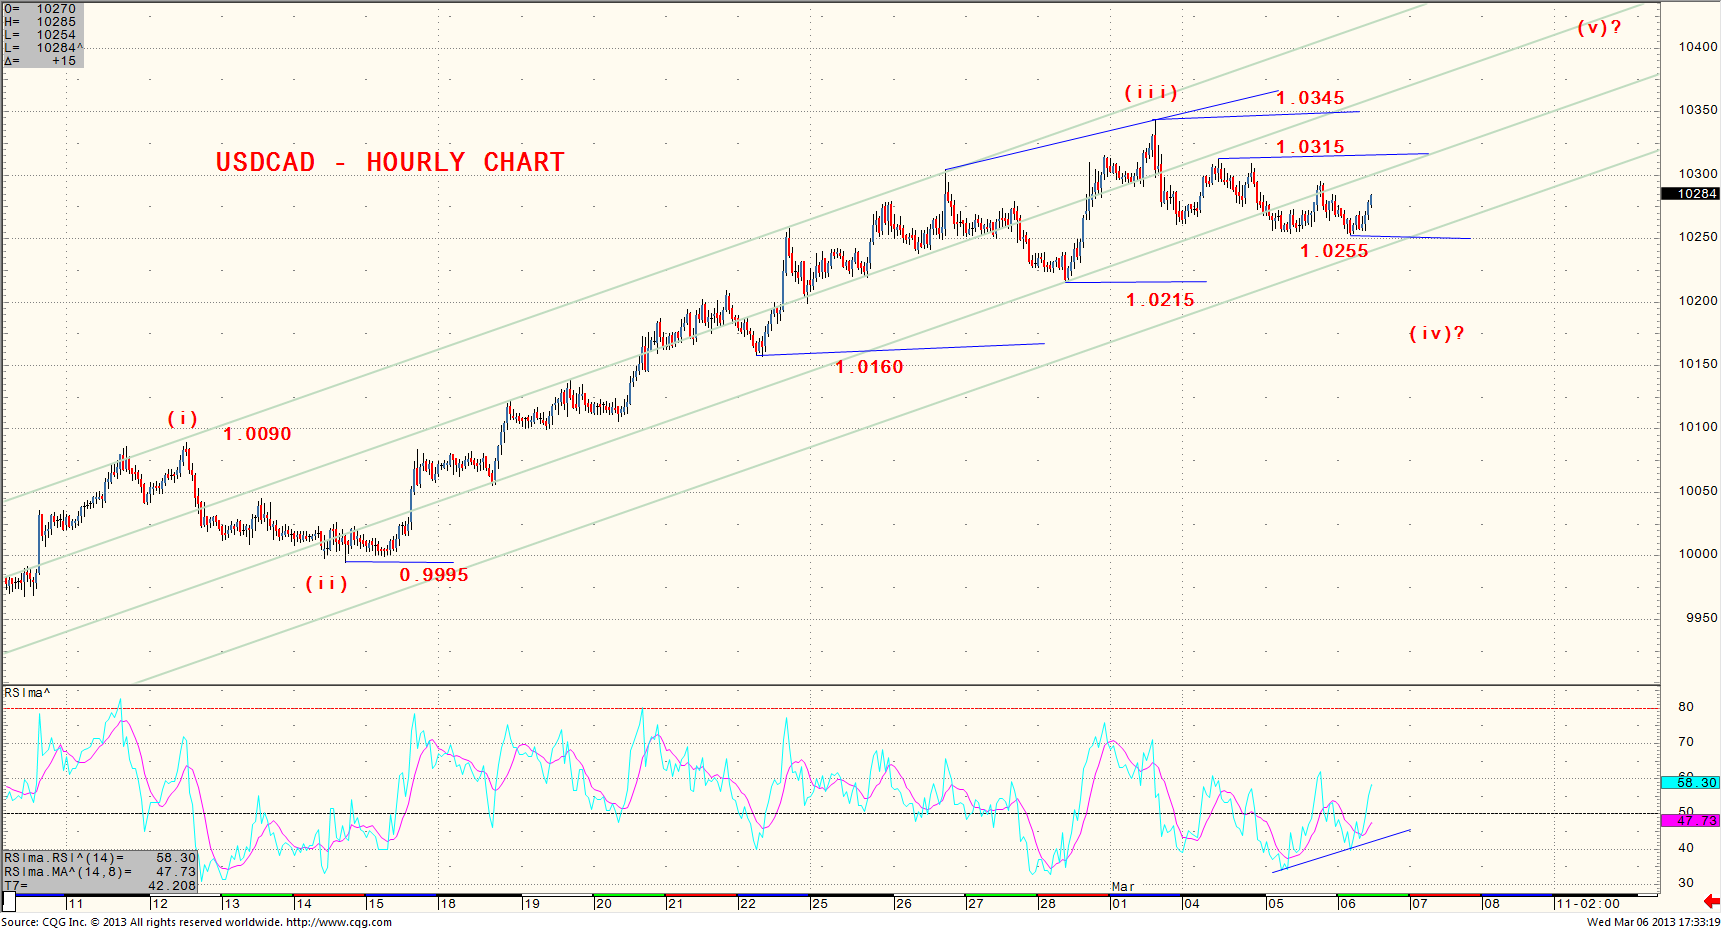
A wave (iii) high may be in place at 1.0345 and the pair may be in a wave (iv) consolidation now. The consolidation may become a complex shallow one. Expect the 1.0315/1.0345 resistance to cap strength in the immediate term. A break below 1.0250 would refocus on the 1.0215/1.0200 support ahead of 1.0160 before renewing.
Trading Strategy - Swing traders need to wait for longs. Day trade longs may be considered at 1.0270 with stop at 1.0253 for a target of 1.0300.
USD/SGD
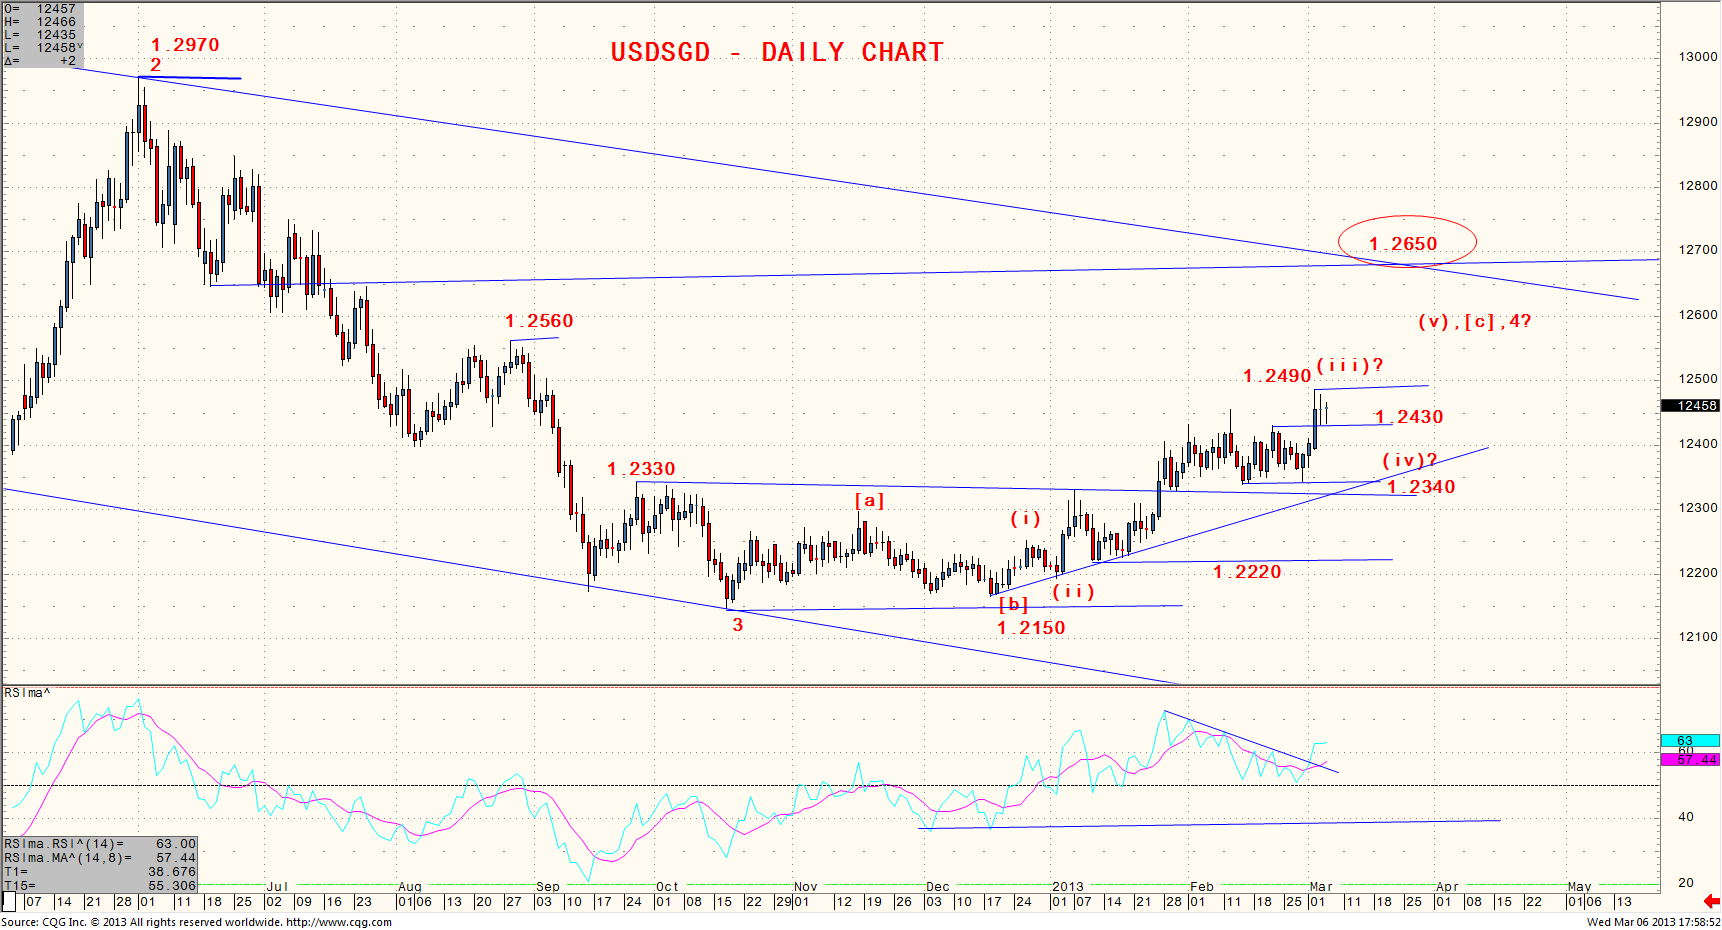
Technical View - A larger setback from 1.3200 (October ’11 high) may be unfolding in a multi-month diagonal fifth wave which could target below 1.1990 (Alt- a running wave (4) triangle). The short term uptrend from 1.2150 may be a wave 4 which may test the 1.2510/1.2560 resistance (key resistance at wedge line around 1.2650). A reversal below 1.2330/1.2220 renews bears for 1.2150 initially.
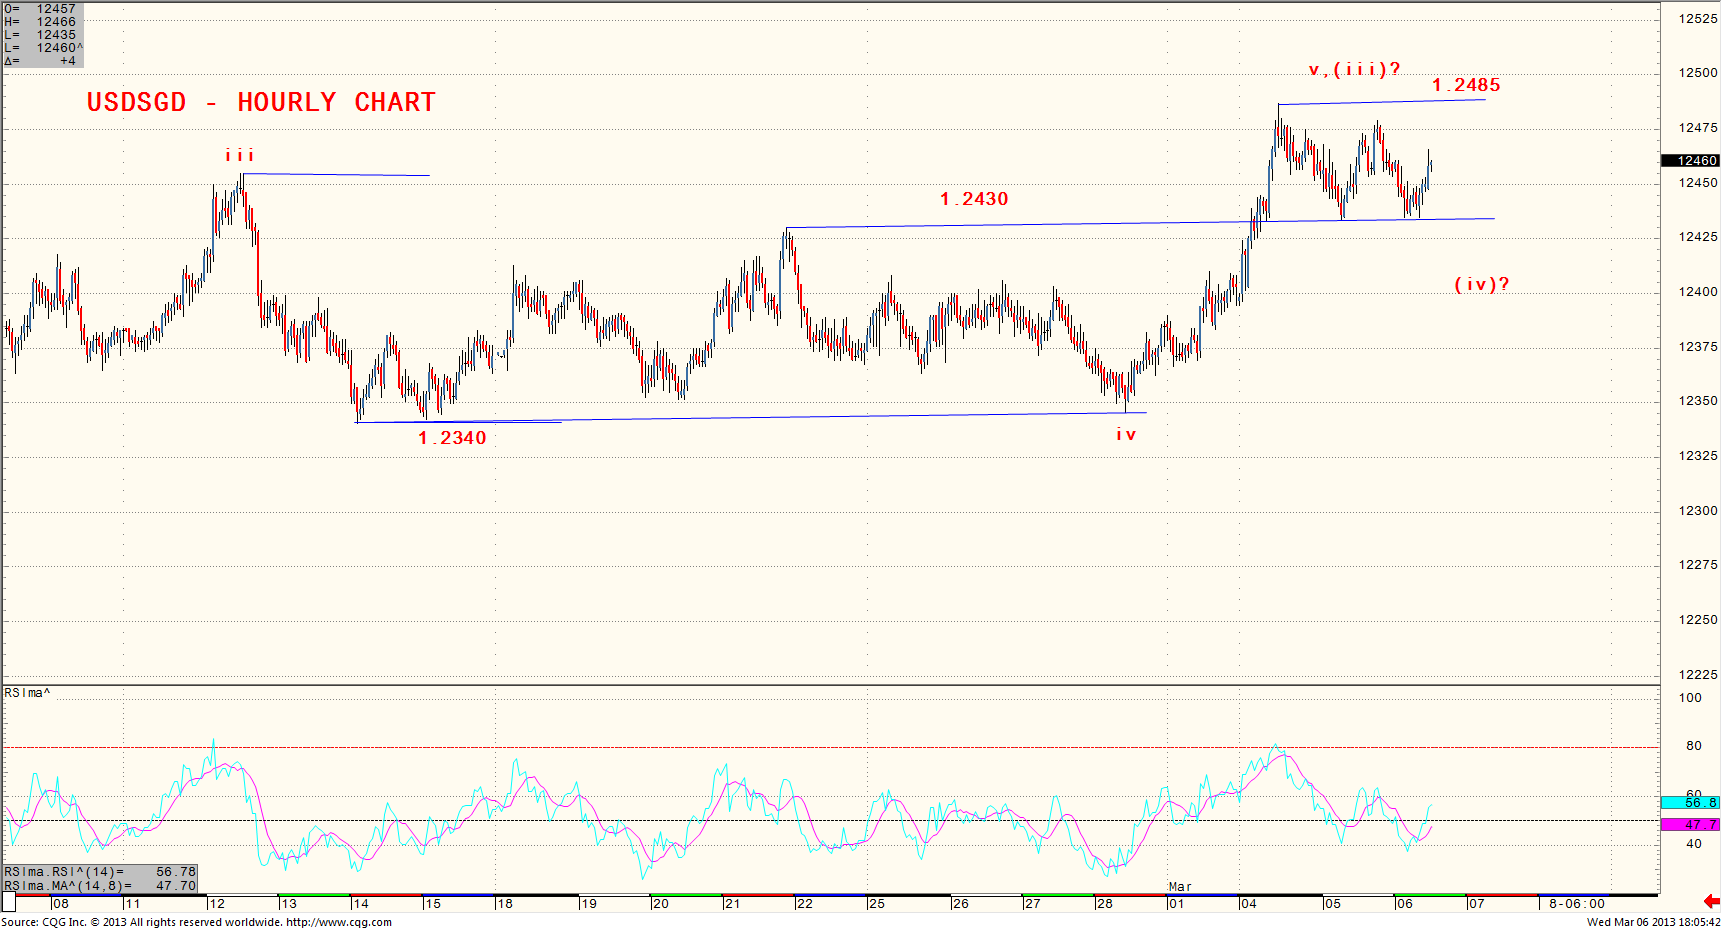
The pair has been trapped in a narrow range. A break below 1.2430 would refocus on 1.2400/1.2340 before renewing the corrective uptrend. Upside may be limited in the immediate term. A break above 1.2480 targets 1.2500/1.2510 next.
Trading Strategy - Stay on side lines
