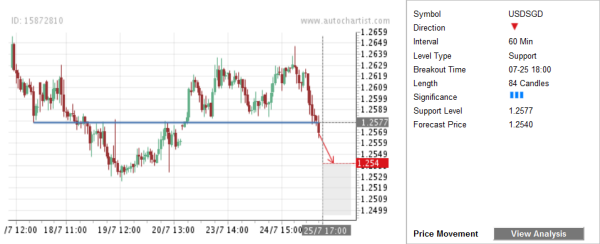
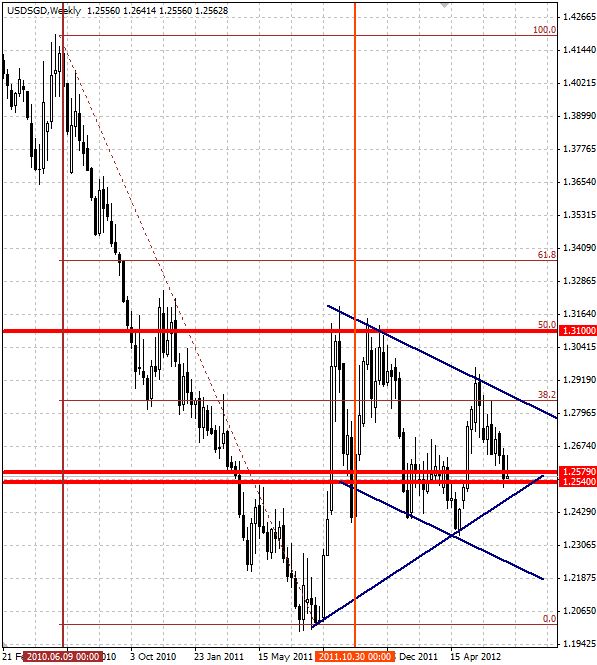
USD/SGD has recently broken down through the horizontal Key Level support 1.2577 identified by Autochartist on the hourly charts. The Significance of this Key Level is rated at the 3 bar level. This Key Level Breakout is aligned with the long-term predominant downtrend visible on the daily and the weekly charts. More specifically, this Breakout continues the medium-term downtrend which started in the end of 2011, when the pair repeatedly failed to break up above the strong resistance area lying at the intersection of the round price level 1.3100 and the 50% Fibonacci Retracement of the previous sharp weekly downward price thrust from the middle of 2010 (as is shown on the second chart below). The pair is expected to fall further in the direction of the Forecast Price 1.2540.
The following weekly USD/SGD chart shows the longer-term picture of this currency pair’s movement:
- English (UK)
- English (India)
- English (Canada)
- English (Australia)
- English (South Africa)
- English (Philippines)
- English (Nigeria)
- Deutsch
- Español (España)
- Español (México)
- Français
- Italiano
- Nederlands
- Português (Portugal)
- Polski
- Português (Brasil)
- Русский
- Türkçe
- العربية
- Ελληνικά
- Svenska
- Suomi
- עברית
- 日本語
- 한국어
- 简体中文
- 繁體中文
- Bahasa Indonesia
- Bahasa Melayu
- ไทย
- Tiếng Việt
- हिंदी
Daily Forex Update: USD/SGD
Published 07/26/2012, 05:43 AM
Updated 03/09/2019, 08:30 AM
Daily Forex Update: USD/SGD
Latest comments
Loading next article…
Install Our App
Risk Disclosure: Trading in financial instruments and/or cryptocurrencies involves high risks including the risk of losing some, or all, of your investment amount, and may not be suitable for all investors. Prices of cryptocurrencies are extremely volatile and may be affected by external factors such as financial, regulatory or political events. Trading on margin increases the financial risks.
Before deciding to trade in financial instrument or cryptocurrencies you should be fully informed of the risks and costs associated with trading the financial markets, carefully consider your investment objectives, level of experience, and risk appetite, and seek professional advice where needed.
Fusion Media would like to remind you that the data contained in this website is not necessarily real-time nor accurate. The data and prices on the website are not necessarily provided by any market or exchange, but may be provided by market makers, and so prices may not be accurate and may differ from the actual price at any given market, meaning prices are indicative and not appropriate for trading purposes. Fusion Media and any provider of the data contained in this website will not accept liability for any loss or damage as a result of your trading, or your reliance on the information contained within this website.
It is prohibited to use, store, reproduce, display, modify, transmit or distribute the data contained in this website without the explicit prior written permission of Fusion Media and/or the data provider. All intellectual property rights are reserved by the providers and/or the exchange providing the data contained in this website.
Fusion Media may be compensated by the advertisers that appear on the website, based on your interaction with the advertisements or advertisers.
© 2007-2025 - Fusion Media Limited. All Rights Reserved.
