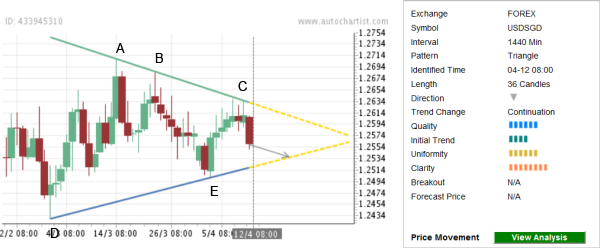
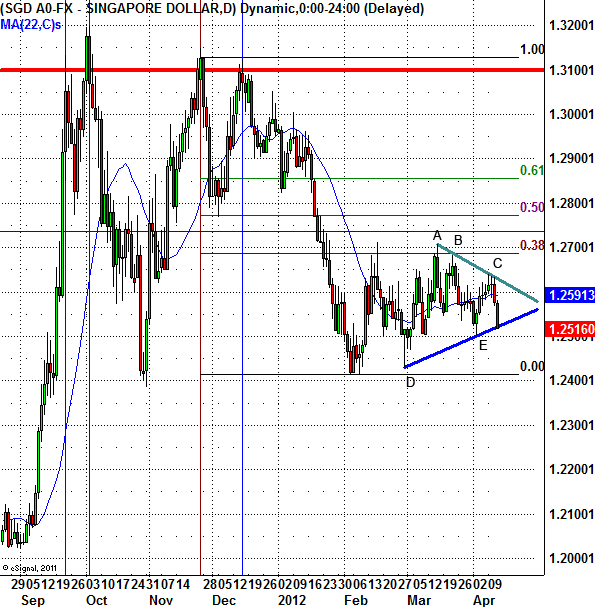
USD/SGD continues to fall inside the Clear Triangle chart pattern identified by Autochartist on the daily charts. The overall Quality of this chart pattern is rated by Autochartist at the 6 bar level – reflecting the below-average Initial Trend (4 bars), higher Uniformity (6 bars) and significant Clarity (8 bars). Higher Clarity indicates wider agreement among the market participants regarding the recent downward movement of this currency pair. This chart pattern continues the overriding downtrend visible on the daily and the weekly USD/SGD charts. More specifically this Triangle follows the previous sharp downward price impulse from the strong resistance at 1.3100 (which had reversed the pair down multiple times over the last few months). Both of the first two connecting points of the upper resistance trendline of this Triangle (points A and B on the chart below) formed when the pair failed to break up above the 38,2% Fibonacci Retracement of the aforementioned preceding daily downward price impulse from 1.3100. The pair is expected to continue downward movement in the nearest time.

The following daily USD/SGD chart shows the technical price levels mentioned above:


The following daily USD/SGD chart shows the technical price levels mentioned above:

