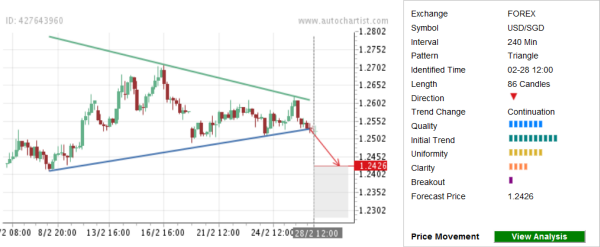
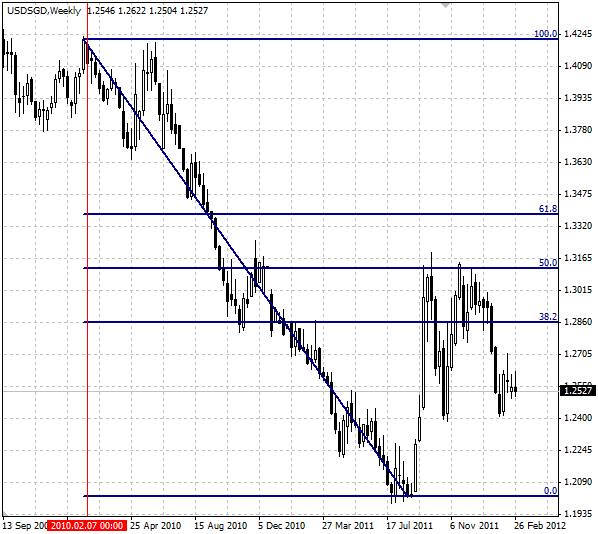
USD/SGD has recently completed the Uniform Triangle chart pattern identified by Autochartist on the 4-hour charts. The overall Quality of this chart pattern is rated at the 7 bar level as a result of the sharp Initial Trend (rated at the highest 10 bar level), significant Uniformity (7 bars) and lower Clarity (4 bars). This Triangle continues the prevailing downtrend that can be seen on the daily and the weekly USD/SGD charts. Maximum Initial Trend reflects the strength of the preceding daily downward price impulse from the 50% Fibonacci Retracement of the previous sharp weekly downward price impulse from the February of 2010 (shown on the third chart below). The pair is expected to fall further in the direction of the Forecast Price 1.2426.
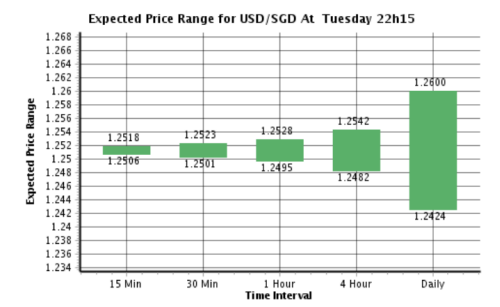
As can be seen form the PowerStats chart below, the lower boundary of the daily Expected Price Range for USD/SGD for tomorrow (1.2424) coincides with the Forecast Price (1.2426) calculated for the completion of the above Triangle – which increases the probability that this currency pair will continue to move toward this level in the nearest time.
The following weekly USD/SGD shows the longer-term picture of this currency pair’s movement: USD/SGD" title="USD/SGD" width="598" height="534">
- English (UK)
- English (India)
- English (Canada)
- English (Australia)
- English (South Africa)
- English (Philippines)
- English (Nigeria)
- Deutsch
- Español (España)
- Español (México)
- Français
- Italiano
- Nederlands
- Português (Portugal)
- Polski
- Português (Brasil)
- Русский
- Türkçe
- العربية
- Ελληνικά
- Svenska
- Suomi
- עברית
- 日本語
- 한국어
- 简体中文
- 繁體中文
- Bahasa Indonesia
- Bahasa Melayu
- ไทย
- Tiếng Việt
- हिंदी
Daily Forex Update: USD/SGD
Published 02/29/2012, 05:04 AM
Updated 03/09/2019, 08:30 AM
Daily Forex Update: USD/SGD
Latest comments
Loading next article…
Install Our App
Risk Disclosure: Trading in financial instruments and/or cryptocurrencies involves high risks including the risk of losing some, or all, of your investment amount, and may not be suitable for all investors. Prices of cryptocurrencies are extremely volatile and may be affected by external factors such as financial, regulatory or political events. Trading on margin increases the financial risks.
Before deciding to trade in financial instrument or cryptocurrencies you should be fully informed of the risks and costs associated with trading the financial markets, carefully consider your investment objectives, level of experience, and risk appetite, and seek professional advice where needed.
Fusion Media would like to remind you that the data contained in this website is not necessarily real-time nor accurate. The data and prices on the website are not necessarily provided by any market or exchange, but may be provided by market makers, and so prices may not be accurate and may differ from the actual price at any given market, meaning prices are indicative and not appropriate for trading purposes. Fusion Media and any provider of the data contained in this website will not accept liability for any loss or damage as a result of your trading, or your reliance on the information contained within this website.
It is prohibited to use, store, reproduce, display, modify, transmit or distribute the data contained in this website without the explicit prior written permission of Fusion Media and/or the data provider. All intellectual property rights are reserved by the providers and/or the exchange providing the data contained in this website.
Fusion Media may be compensated by the advertisers that appear on the website, based on your interaction with the advertisements or advertisers.
© 2007-2025 - Fusion Media Limited. All Rights Reserved.
