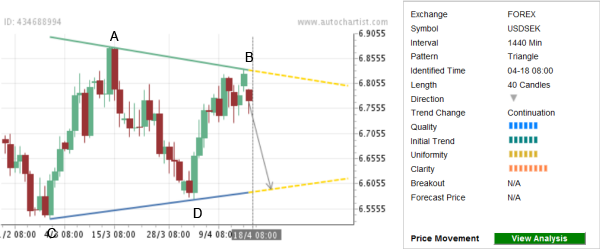
USD/SEK continues to fall inside the clearly-formed Triangle chart pattern on the daily charts. The overall Quality of this chart pattern is measured at the 6 bar level as a result of the equally measured Initial Trend and Uniformity as well as the near-maximum Clarity (rated at the 8 bar level). This Triangle continues the strong downtrend visible on the daily and the weekly USD/SEK charts. More specifically, this Triangle follows the sharp preceding down-thrust from the major resistance at the round price level 7.0000.
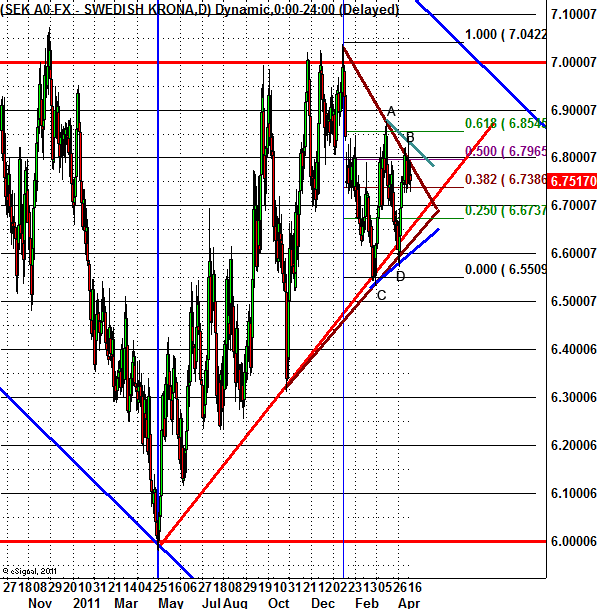
Points A and B of this Triangle formed when the pair reversed down from the two consecutive Fibonacci Retracement levels of the aforementioned preceding downward price impulse from 7.0000 – point A formed at the 61,8% Fibonacci Retracement and the B at the 50% Fibonacci Correction of this impulse. These two points also stand close to the upper resistance trendline of the longer-term Triangle (shown on the second chart below) – which increases the chances that the pair will fall further in the nearest time.

The following daily USD/SEK chart shows the technical price levels which have affected the recent movement of this currency pair:

Points A and B of this Triangle formed when the pair reversed down from the two consecutive Fibonacci Retracement levels of the aforementioned preceding downward price impulse from 7.0000 – point A formed at the 61,8% Fibonacci Retracement and the B at the 50% Fibonacci Correction of this impulse. These two points also stand close to the upper resistance trendline of the longer-term Triangle (shown on the second chart below) – which increases the chances that the pair will fall further in the nearest time.

The following daily USD/SEK chart shows the technical price levels which have affected the recent movement of this currency pair:

