
USD/SEK has recently completed the clearly-formed Down Channel chart pattern identified by Autochartist on the daily charts. The overall Quality of this chart pattern is measured at the 7 bar level, as a result of the below average Initial Trend (rated at the 4 bar level) and near-maximum Uniformity and Clarity (both rated at the high 9 bar level). This chart pattern continues the medium-term uptrend which started in May of 2011 when the pair reversed up from the major support at the round price level 6.0000. The bottom of this chart pattern (point D on the chart below) formed when the price reversed from the uptrend support trendline from the May of 2011 running close to the 50% Fibonacci Retracement of the price move from the May of 2011 to the start of 2012 (as is shown on the second chart below). USD/SEK is expected to rise further toward the Forecast Price 6.8736.

The following daily USD/SEK chart highlights the technical price levels mentioned above:
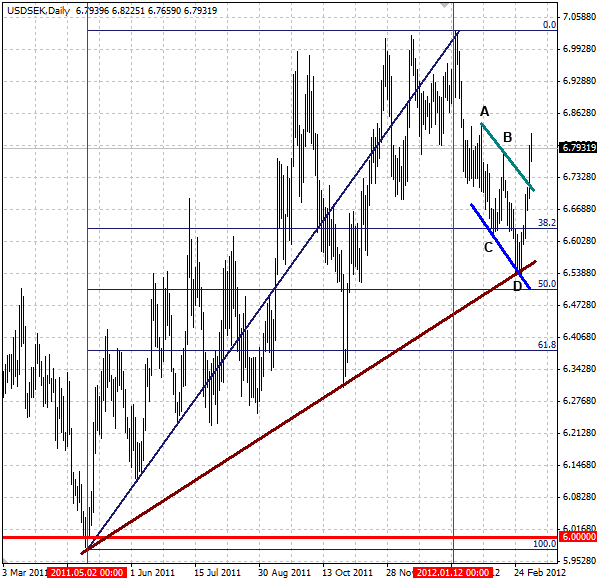 USD/SEK" title="USD/SEK" width="597" height="581" />
The following daily USD/SEK chart highlights the technical price levels mentioned above:
USD/SEK" title="USD/SEK" width="597" height="581" />