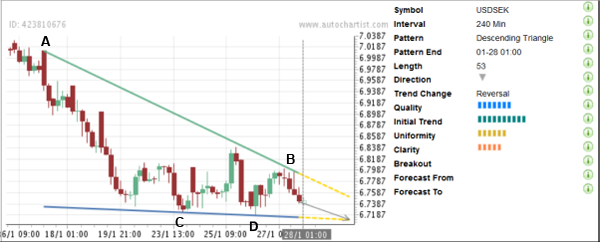
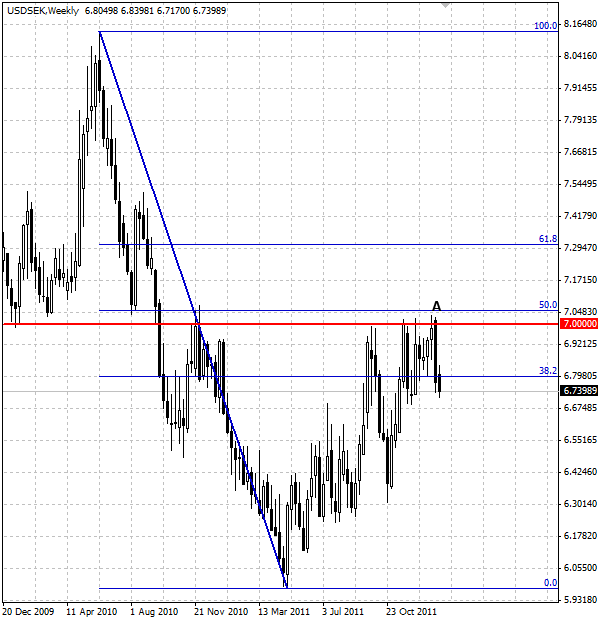
USD/SEK continues to decline inside the Descending Triangle chart pattern identified by Autochartist on the 4-hour charts. The overall Quality of this chart pattern is measured at the 7 bar level which reflects high Initial trend (rated at the maximum 10 bar level), significant Uniformity (6 bars) and average Clarity (5 bars). This chart pattern reverses the previous upward correction to the preceding sharp weekly downward price impulse. The top of this chart pattern (point A on the chart below) formed when the pair reversed sharply down from the strong combined resistance area lying at the intersection of the major round price level 7.0000 and the 50% Fibonacci Retracement of the aforementioned proceeding weekly downward price impulse (as is shown on the second chart below). The pair is expected to decline further in the nearest time.

The following weekly USD/SEK chart shows the longer-term picture of this currency pair’s movement:


The following weekly USD/SEK chart shows the longer-term picture of this currency pair’s movement:

