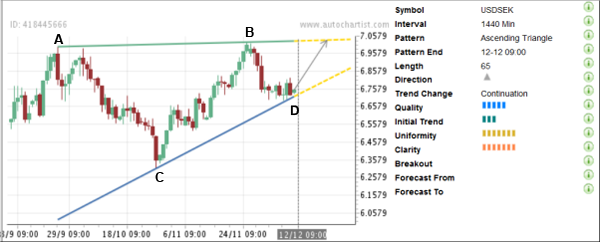
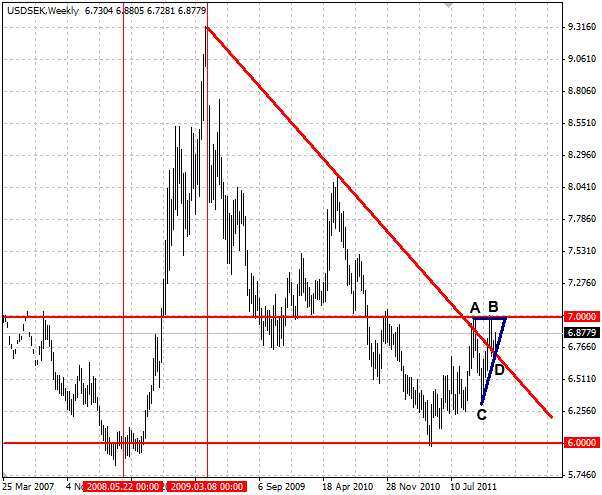
USD/SEK continues to advance inside the well-formed Ascending Triangle chart pattern identified by Autochartist on the daily charts. The overall Quality of this chart pattern is measured at the 5 bar level as a result of the low Initial Trend (rated at the 3 bar level) and higher Uniformity and Clarity (both rated at the 7 bar level). This chart pattern continues the previous upward price impulse from the major long-term level of support 6.0000 (which had previously reversed the strong downtrend in the middle of 2008, as is shown on the second chart below). Both connecting points of the upper resistance trendline of this Triangle (points A and B on the chart below) formed when the pair reversed down from the strong resistance at the round price level 7.0000. The price has recently reversed up (at point D) from the longer-term downward trendline acting as support now – after it was recently broken on the upside by the previous C to B upward price impulse – as well as from the 38,2% Fibonacci Retracement of the C to B impulse. The pair is expected to rise further in the nearest time.

The following weekly USD/SEK chart highlights the technical price levels mentioned above:


The following weekly USD/SEK chart highlights the technical price levels mentioned above:

