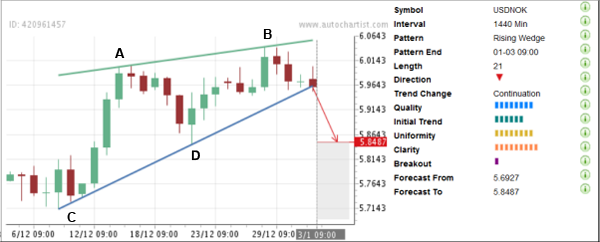
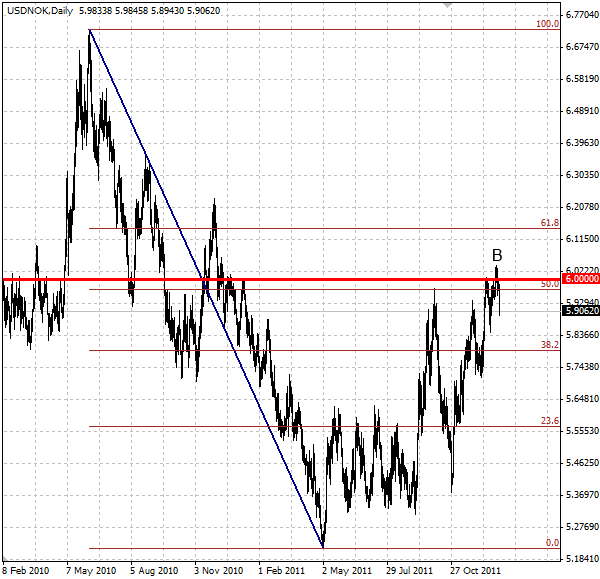
USD/NOK has recently completed the Clear Rising Wedge chart pattern identified by Autochartist on the daily charts. The overall Quality of this Rising Wedge is measured at the high 8 bar level as a consequence of the above-average Initial Trend (rated at the 6 bar level), substantial Uniformity (8 bars) and near maximum Clarity (9 bars). Both of the connecting points of the upper resistance trendline of this chart pattern (points A and B on the chart below) formed when the pair failed to break up above the resistance zone lying between the round price level 6.0000 and the 50% Fibonacci Retracement of the previous strong daily downward price impulse (as is shown on the second chart below). The pair is expected to fall further in the direction of the Forecast Area located between price levels 6.6927 and 5.8487.

The daily USD/NOK chart below demonstrates the price levels mentioned above:


The daily USD/NOK chart below demonstrates the price levels mentioned above:

