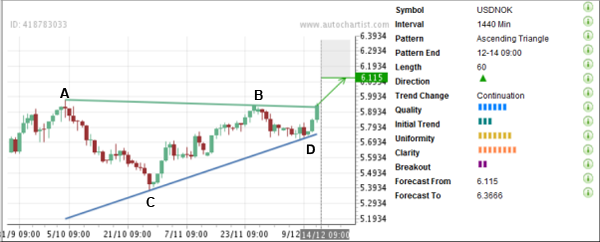
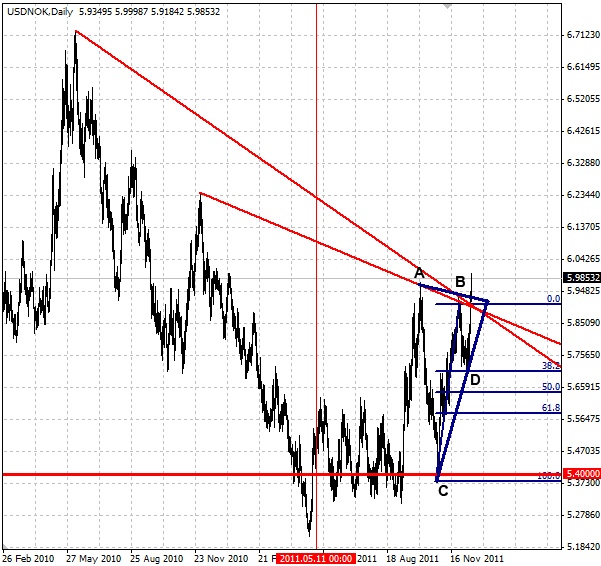
USD/NOK has recently completed the high Clarity Ascending Triangle chart pattern identified by Autochartist on the daily charts. The overall Quality of this chart pattern is measured at the 6 bar level as a result of the low Initial Trend (rated at 3 bar level), significant Uniformity (7 bars) and near maximum Clarity (8 bars). This chart pattern continues the preceding sharp upward price impulse from the support at 5.4000 which had previously reversed the pair up a few times over the last few months (as is shown on the second chart below). The bottom of this chart pattern (point C on the chart below) formed when the pair reversed from the aforementioned support at 5.4000. The pair has recently reversed up (at point D) from the 38,2% Fibonacci Retracement of the C to B upward price impulse. This upward reversal led to the Breakout through the upper resistance trendline of this Ascending Triangle (coinciding with the Breakout through the two longer-term downtrend lines shown on the second chart below). The pair is expected to rise further toward the Forecast Area set between price levels 6.115 and 6.3666.
The following daily USD/NOK chart demonstrates the technical price levels mentioned above:
- English (UK)
- English (India)
- English (Canada)
- English (Australia)
- English (South Africa)
- English (Philippines)
- English (Nigeria)
- Deutsch
- Español (España)
- Español (México)
- Français
- Italiano
- Nederlands
- Português (Portugal)
- Polski
- Português (Brasil)
- Русский
- Türkçe
- العربية
- Ελληνικά
- Svenska
- Suomi
- עברית
- 日本語
- 한국어
- 简体中文
- 繁體中文
- Bahasa Indonesia
- Bahasa Melayu
- ไทย
- Tiếng Việt
- हिंदी
Daily Forex Update: USD/NOK
Published 12/15/2011, 08:26 AM
Updated 03/09/2019, 08:30 AM
Daily Forex Update: USD/NOK
Latest comments
Loading next article…
Install Our App
Risk Disclosure: Trading in financial instruments and/or cryptocurrencies involves high risks including the risk of losing some, or all, of your investment amount, and may not be suitable for all investors. Prices of cryptocurrencies are extremely volatile and may be affected by external factors such as financial, regulatory or political events. Trading on margin increases the financial risks.
Before deciding to trade in financial instrument or cryptocurrencies you should be fully informed of the risks and costs associated with trading the financial markets, carefully consider your investment objectives, level of experience, and risk appetite, and seek professional advice where needed.
Fusion Media would like to remind you that the data contained in this website is not necessarily real-time nor accurate. The data and prices on the website are not necessarily provided by any market or exchange, but may be provided by market makers, and so prices may not be accurate and may differ from the actual price at any given market, meaning prices are indicative and not appropriate for trading purposes. Fusion Media and any provider of the data contained in this website will not accept liability for any loss or damage as a result of your trading, or your reliance on the information contained within this website.
It is prohibited to use, store, reproduce, display, modify, transmit or distribute the data contained in this website without the explicit prior written permission of Fusion Media and/or the data provider. All intellectual property rights are reserved by the providers and/or the exchange providing the data contained in this website.
Fusion Media may be compensated by the advertisers that appear on the website, based on your interaction with the advertisements or advertisers.
© 2007-2025 - Fusion Media Limited. All Rights Reserved.
