
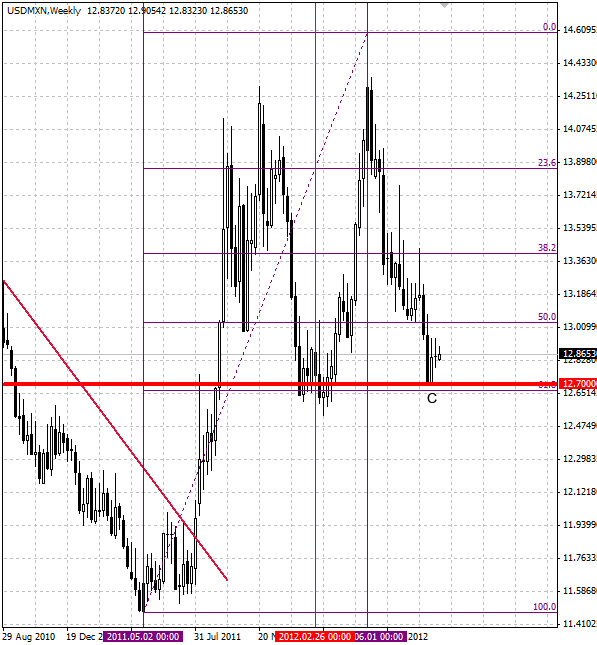
USD/MXN recently broke the Clear Triangle chart pattern identified by Autochartist on the daily charts. The overall Quality of this Triangle is rated 6 bar level as a result of the low Initial Trend (4 bars) and high Uniformity and Clarity (rated at the 8 and 9 bar levels respectively). The completion of this Triangle continues the prevailing uptrend visible on the weekly USD/MXN charts. The bottom of this Triangle (point C on the chart below) formed when the pair reversed up from the strong support area made out of the support level 12.7 (which had previously reversed the pair sharply up at the start of this year) and the 61.8% Fibonacci Retracement of the preceding year-long upward price move from the middle of 2011 to the middle of 2012. The pair is expected to rise further toward the Forecast Price 13.1083.

The weekly USD/MXN chart below shows the technical price levels mentioned above:
 USD/MXN" title="USD/MXN" width="597" height="645" />
The weekly USD/MXN chart below shows the technical price levels mentioned above:
USD/MXN" title="USD/MXN" width="597" height="645" />