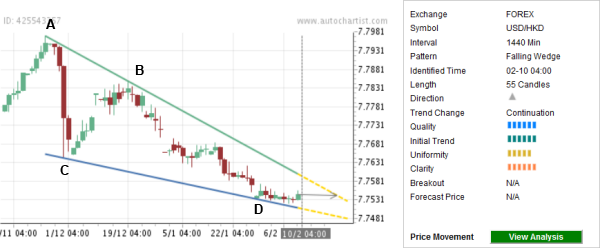
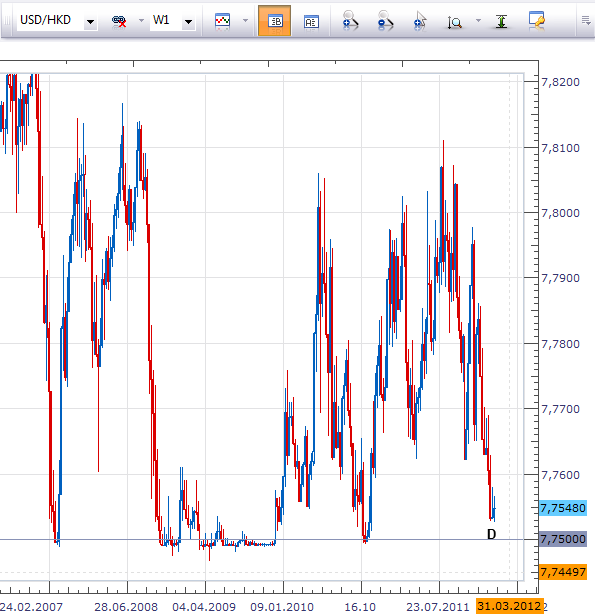
Autochartist has recently identified the Falling Wedge chart pattern on the daily USD/HKD charts. The overall Quality of this chart pattern is measured at the 6 bar level, as a result of the above-average Initial trend and Clarity (both rated at the 6 bar level) as well as the average Uniformity (5 bars). The bottom of this Falling Wedge (point D on the chart below) formed when the pair reversed up from the support area above the major long-term support level 7.7500 which had been reversing the pair up for the last few years (as can be seen on the second chart below). The pair is expected to rise further in the nearest time.

The following weekly USD/HKD chart shows pervious price action close to the major support at 7.7500:
 USD/HKD" title="USD/HKD" width="595" height="616" />
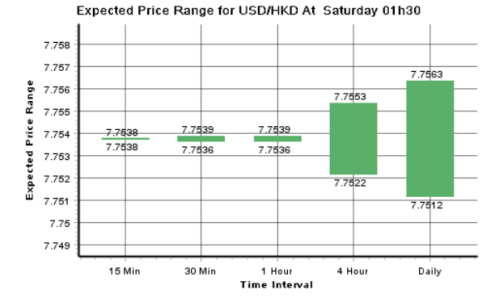
As you can seen from the following PowerStats chart, all of the latest daily Expected Price Range for USD/HKD (from 7.7512 to 7.7563) stands above the aforementioned strong support at 7.7500, which increases the probability that this currency pair will continue to rise tomorrow.


The following weekly USD/HKD chart shows pervious price action close to the major support at 7.7500:
 USD/HKD" title="USD/HKD" width="595" height="616" />
As you can seen from the following PowerStats chart, all of the latest daily Expected Price Range for USD/HKD (from 7.7512 to 7.7563) stands above the aforementioned strong support at 7.7500, which increases the probability that this currency pair will continue to rise tomorrow.

