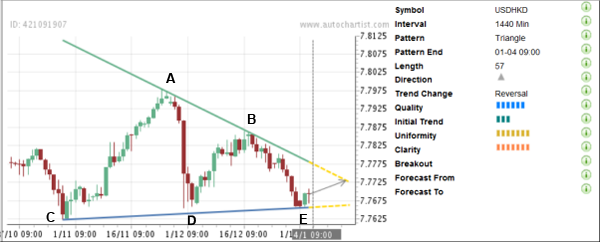
USD/HKD moves inside the well-formed Triangle chart pattern identified by Autochartist on the daily charts. The overall Quality of this chart pattern is measured at the 6 bar level as a result of the low Initial Trend (rated at the 3 bar level) and high Uniformity and Clarity (both measured at the 8 bar level). This chart pattern reverses the previous sharp downward daily price impulse, which was stopped by the strong level of support at 7.7650 (which had previously reversed the pair sharply up in May of 2011) – creating the first connecting point of the lower support trendline of this Triangle, point C on the chart below . The subsequent upward reversals near the lower support trendline (at points D and E) also occurred when the pair failed to break down below the support level 7.7650. The pair is expected to rise further in the nearest time.

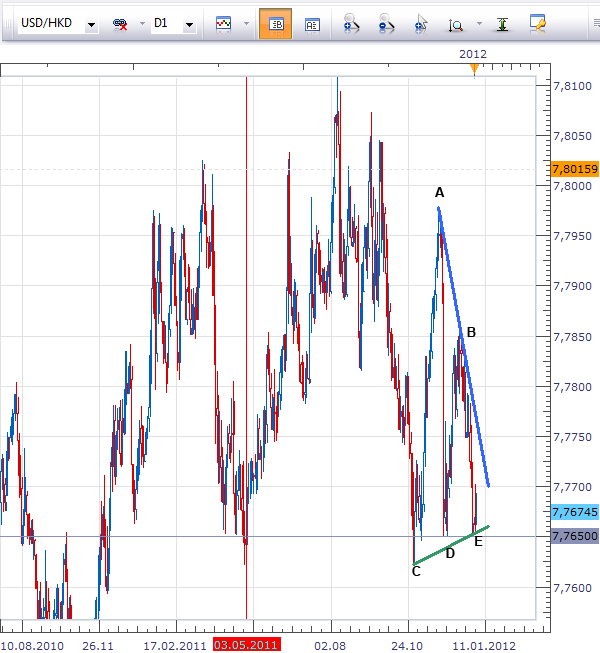
The daily USD/HKD chart below shows previous price action close to the major long-term support level 7.7650:


The daily USD/HKD chart below shows previous price action close to the major long-term support level 7.7650:

