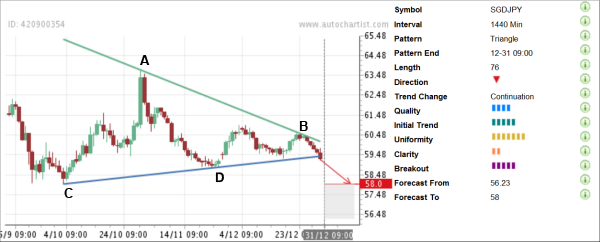
SGD/JPY has completed the Uniform Triangle chart pattern identified by Autochartist on the daily charts. Autochartist rates the overall Quality of this chart pattern at the 4 bar level as a result of the average Initial Trend (5 bars), higher Uniformity (7 bars) and low Clarity (2 bars). The completion of this Triangle follows the predominant downtrend visible on the daily and the weekly SGD/JPY charts. Higher Uniformity reflects even distribution of the connecting points of the upper and the lower trendlines of this Triangle. It should be noted that the first three sub-waves of this Triangle (from C to A, from A to D and from D to B) are clear-cut three-wave ABC formations, which is characteristic of the Triangles, as which increases the visibility of this chart pattern to the market participants. The pair is expected to decline further toward the Forecast Zone located between price levels 56.23 and 58.00.

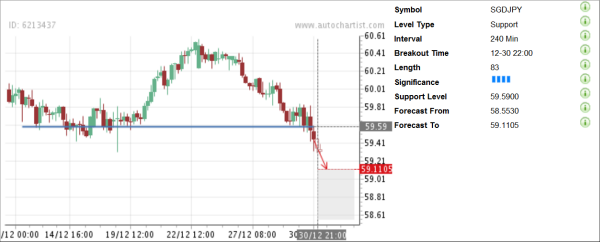
As can be seen on the following 4-hour Key Levels chart for SGD/JPY, the above Breakout coincided with the Breakout through the horizontal support level 59.59, identified earlier by Autochartist. The Breakout through this level increases the chances that this currency pair will continue downward movement in the nearest time.


As can be seen on the following 4-hour Key Levels chart for SGD/JPY, the above Breakout coincided with the Breakout through the horizontal support level 59.59, identified earlier by Autochartist. The Breakout through this level increases the chances that this currency pair will continue downward movement in the nearest time.

