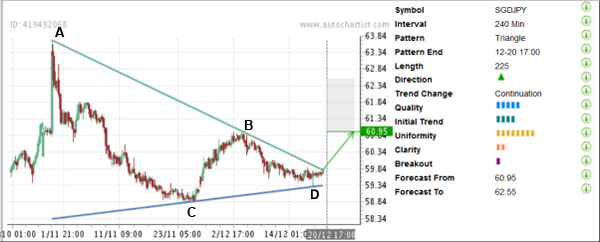
SGD/JPY has recently completed the Uniform Triangle chart pattern identified by Autochartist on the 4-hour charts. The length of this chart pattern is equal to 225 candles. The overall Quality of this Triangle is rated at the 5 bar level as a consequence of the below average Initial Trend (measured at the 4 bar level), near maximum Uniformity (8 bars) and low Clarity (2 bars). The completion of this chart pattern follows the previous upward price impulse from the strong level of support 59.00, which helped create the bottom of this Triangle (point C on the chart below). The price is expected to rise further toward the Forecast Area located between price levels 60.95 and 62.55, which is also indicated by the PowerStats analysis shown below.

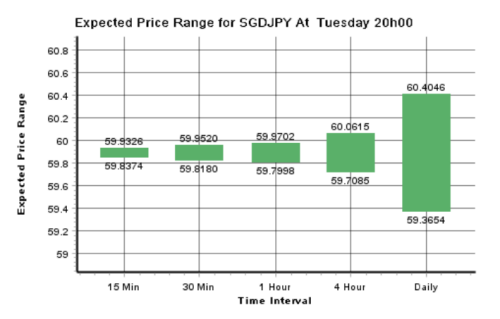
As can be seen from the following PowerStats chart below, most of the daily Expected Price Range for SGD/JPY for tomorrow (the measure of price volatility calculated separately for each time frame chart, from 60.4046 to 59.3654) stands above the upper resistance trendline of this Triangle which has recently been broken. This increases the likelihood that this currency pair will continue to rise tomorrow.


As can be seen from the following PowerStats chart below, most of the daily Expected Price Range for SGD/JPY for tomorrow (the measure of price volatility calculated separately for each time frame chart, from 60.4046 to 59.3654) stands above the upper resistance trendline of this Triangle which has recently been broken. This increases the likelihood that this currency pair will continue to rise tomorrow.

