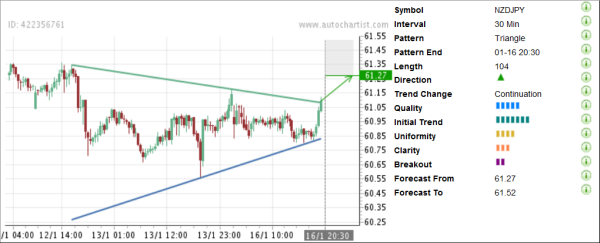
NZD/JPY has recently completed the Triangle chart pattern identified by Autochartist on the 30-minute charts. Autochartist measures the Quality of this Triangle at the average 5 bar level, as a result of the strong Initial Trend (rated at the 7 bar level), below-average Uniformity (4 bars) and lower Clarity (3 bars). The completion of this Triangle continues the sharp preceding daily upward impulse from the major level of support 57.00, which had reversed the pair up a few times over the last two years (as is shown on the third chart below). The pair is expected to rise further in the direction of the Forecast Area located between price levels 61.27 and 61.52.

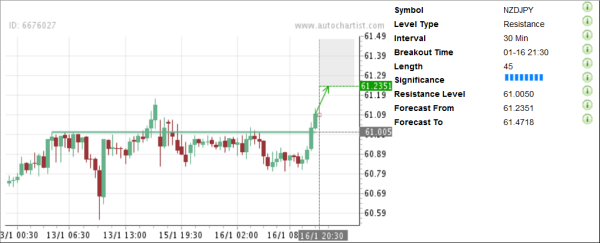
As you can see from the following 30-minute Key Levels chart for NZD/JPY, the above Triangle Breakout coincided with the Breakout through the horizontal Resistance level 61.005, identified earlier by Autochartist. Two breakouts in one direction increase the probability that NZD/JPY will continue upward movement in the nearest time.

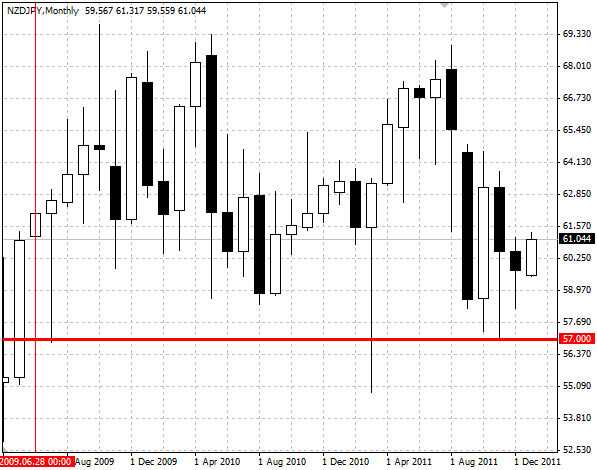
The monthly NZD/JPY chart below shows the previous price action close to the strong support at 57.00:
 NZD/JPY" title="NZD/JPY" width="597" height="470" />

As you can see from the following 30-minute Key Levels chart for NZD/JPY, the above Triangle Breakout coincided with the Breakout through the horizontal Resistance level 61.005, identified earlier by Autochartist. Two breakouts in one direction increase the probability that NZD/JPY will continue upward movement in the nearest time.

The monthly NZD/JPY chart below shows the previous price action close to the strong support at 57.00:
 NZD/JPY" title="NZD/JPY" width="597" height="470" />