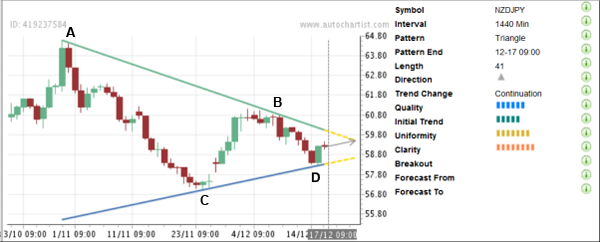
NZD/JPY continues to advance within the well-formed Triangle chart pattern identified by Autochartist on the daily charts. The overall Quality of this chart pattern is measured at the 6 bar level which reflects the following values of the individual contributing indicators: average Initial Trend (rated at the 5 bar level), higher Uniformity (7 bars) and near maximum Clarity (8 bars). The bottom of this chart pattern (point C on the third chart below) formed when the pair reversed up from the strong support at 57.00 (which had previously reversed the pair twice over the last year, as is shown on the third chart below). The pair is expected to continue upward movement in the nearest time.

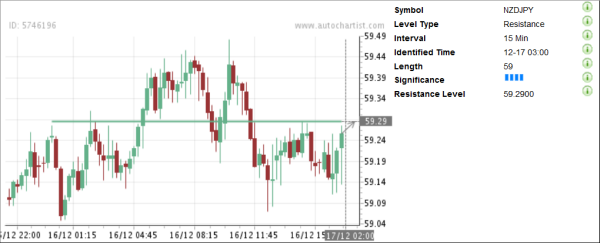
As can be seen on the following Key Levels chart for NZD/JPY, the pair has been recently trading close to the horizontal Resistance level 59.29, identified by Autochartist. This level should be broken for the pair to rise further.

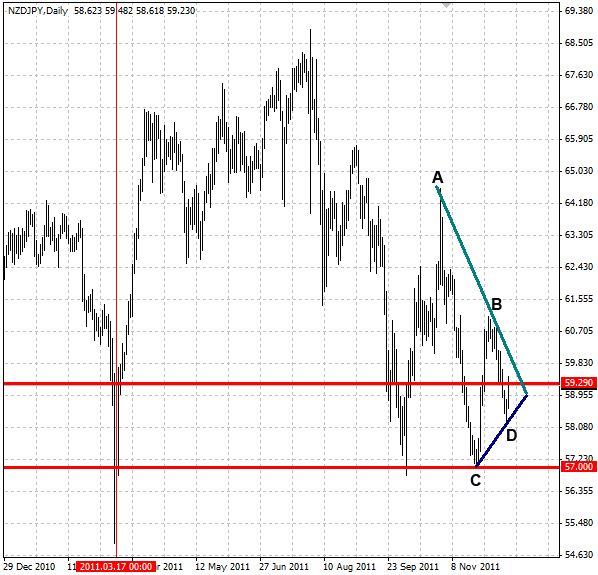
The following daily NZD/JPY chart highlights the aforementioned technical price levels:


As can be seen on the following Key Levels chart for NZD/JPY, the pair has been recently trading close to the horizontal Resistance level 59.29, identified by Autochartist. This level should be broken for the pair to rise further.

The following daily NZD/JPY chart highlights the aforementioned technical price levels:

