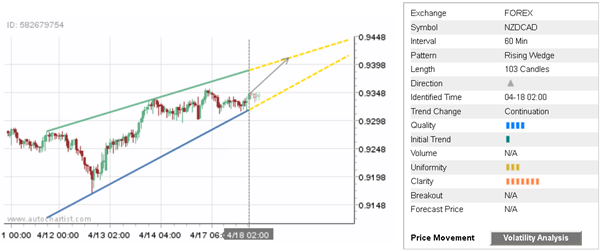
NZD/CAD continues to advance inside the rising wedge chart pattern which was previously identified by Autochartist on the hourly charts. Autochartist rates the quality of this rising wedge at the 4 bar level – which reflects the slow initial trend and uniformity (rated at 1 and 3 bar levels respectively) and significant clarity (7 bars). NZD/CAD is expected to rise further inside this rising wedge – continuing the earlier sharp upward reversal from support zone described below.

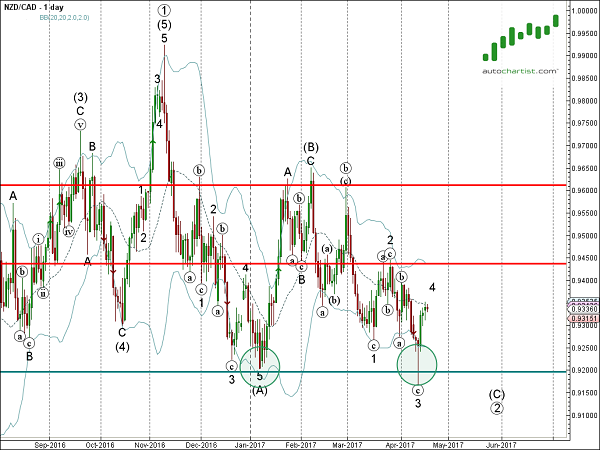
As can be seen from the daily NZD/CAD chart below, the bottom of this rising wedge formed when the pair reversed up from the support zone located between the major support level 0.9200 (which also reversed the price in January) and the lower daily Bollinger Band®. The upward reversal from this support zone created the daily Japanese candlesticks reversal pattern hammer. The proximity of this support area increases the probability NZD/CAD will continue to rise inside this rising wedge.

