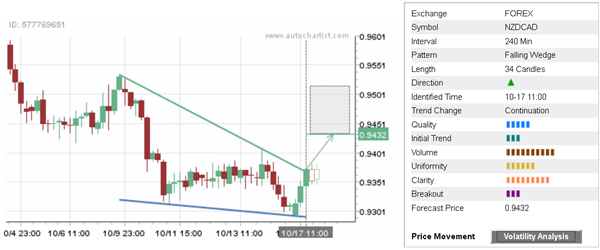
NZD/CAD recently broke the clear falling wedge chart pattern which was previously identified by Autochartist on the 4-hour charts. Autochartist rates the overall quality of this chart pattern at the 5 bar level – which is the result of the low initial trend (3 bars), above-average uniformity (6 bars) and near-maximum clarity (9 bars). Higher clarity reflects the sharpness of the price impulses between the upper and lower trendlines of this chart pattern. NZD/CAD is expected to reach the forecast price 0.9432.

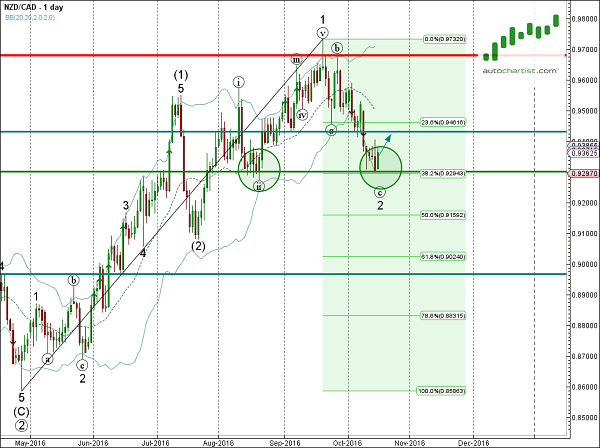
As you can see from the daily NZD/CAD chart below, the bottom of this falling wedge formed when the pair reversed up from the strong support zone lying between the support level 0.9300 (which also reversed the pair in August), lower daily Bolliger Band® and the 38.2% Fibonacci correction of the previous upward impulse from April. The strength of this support zone adds to the probability NZD/CAD will continue to rise toward the forecast price 0.9432.

