Daily Forex Update: NZD/CAD

Published 10/01/2012, 03:44 AM
Updated 03/09/2019, 08:30 AM

NZD/CAD recently broke the Uniform Triangle chart pattern identified by Autochartist on the daily charts. The overall Quality of this Triangle is rated at the 5 bar level as a result of the below average Initial Trend and Clarity (both rated at the 4 bar level) and near maximum Uniformity (8 bars). The completion of this Triangle continues the prevailing uptrend visible on the daily and the weekly NZD/CAD charts. The high Uniformity of this Triangle reflects the even distribution of the connecting points on which the upper and the lower trendlines of this Triangle are built. The bottom of this chart pattern (point C below) formed when the pair reversed up from the 50% Fibonacci Correction of the preceding weekly upward price impulse from March of 2011 standing close to the cluster of the former weekly resistance trendlines – all acting as support now after having been broken by the aforementioned upward price impulse from 2011. The pair is expected to rise further toward the Forecast Price 0.8382.
Dailyfx 1
The monthly NZD/CAD chart below show the longer-term picture of this currency pair’s movement:
<span class=
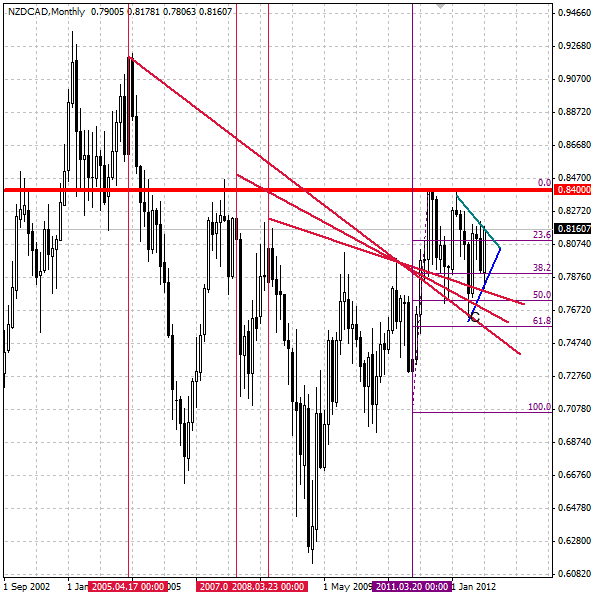
NZD/CAD" title="NZD/CAD" width="591" height="594">

Latest comments

Loading next article…
Risk Disclosure: Trading in financial instruments and/or cryptocurrencies involves high risks including the risk of losing some, or all, of your investment amount, and may not be suitable for all investors. Prices of cryptocurrencies are extremely volatile and may be affected by external factors such as financial, regulatory or political events. Trading on margin increases the financial risks.
Before deciding to trade in financial instrument or cryptocurrencies you should be fully informed of the risks and costs associated with trading the financial markets, carefully consider your investment objectives, level of experience, and risk appetite, and seek professional advice where needed.
Fusion Media would like to remind you that the data contained in this website is not necessarily real-time nor accurate. The data and prices on the website are not necessarily provided by any market or exchange, but may be provided by market makers, and so prices may not be accurate and may differ from the actual price at any given market, meaning prices are indicative and not appropriate for trading purposes. Fusion Media and any provider of the data contained in this website will not accept liability for any loss or damage as a result of your trading, or your reliance on the information contained within this website.
It is prohibited to use, store, reproduce, display, modify, transmit or distribute the data contained in this website without the explicit prior written permission of Fusion Media and/or the data provider. All intellectual property rights are reserved by the providers and/or the exchange providing the data contained in this website.
Fusion Media may be compensated by the advertisers that appear on the website, based on your interaction with the advertisements or advertisers.
© 2007-2025 - Fusion Media Limited. All Rights Reserved.