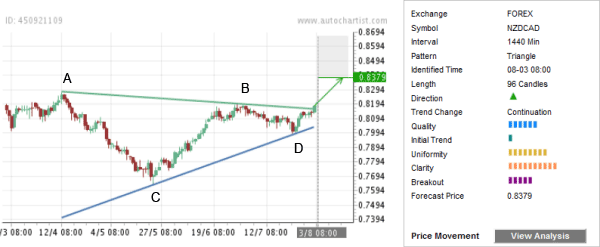
NZD/CAD has recently completed the well-formed Triangle chart pattern identified by Autochartist on the daily charts. The overall Quality of this chart pattern is rated at the 6 bar level as a result of the low Initial Trend (measured at the 2 bar level), significant Uniformity (8 bars) and maximum Clarity (10 bars). Higher Uniformity and Clarity describe the well-formed Triangle with high visibility to the market participants. This chart pattern continues the strong uptrend visible on the daily and the weekly NZD/CAD charts. The pair had previously reversed sharply up (at point D) from the 38,2% Fibonacci Retracement of the preceding up-leg of this Triangle (from C to B) – which led to the breakout of the upper resistance trendline of this Triangle. NZD/CAD is expected to rise further toward the Forecast Price 0.8379.

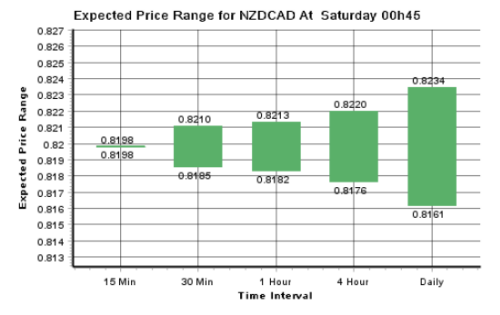
As can be seen from the PowerStats chart below, most of the daily Expected Price Range (from 0.8161 to 0.8234) stands above the broken resistance trendline of the above Triangle – which adds to the likelihood of further gains for NZD/CAD tomorrow.


As can be seen from the PowerStats chart below, most of the daily Expected Price Range (from 0.8161 to 0.8234) stands above the broken resistance trendline of the above Triangle – which adds to the likelihood of further gains for NZD/CAD tomorrow.

