Daily Forex Update: NZD/CAD

Published 07/20/2012, 08:45 AM
Updated 03/09/2019, 08:30 AM

NZD/CAD continues to rise inside the Clear Triangle chart pattern identified by Autochartist on the daily charts. The overall Quality of this Triangle is rated at the 5 bar level as a result of the low Initial Trend (one bar), above-average Uniformity (6 bars) and near-maximum Clarity (9 bars). This chart pattern continues the prevailing uptrend that can be seen on the weekly NZD/CAD charts. The bottom of this Triangle (point C on the chart below) formed when the pair reversed up form the strong support area made out of the following support levels: 50% Fibonacci Retracement of the preceding sharp weekly upward price impulse from the March of 2011, the round price level 0.7700, and the weekly upward-sloping support trendline from the start of 2009 (as is shown on the second chart below). The pair is expected to rise further in the nearest time.

Daily Fx 1
The following weekly NZD/CAD chart shows the technical price levels mentioned above:

<span class=
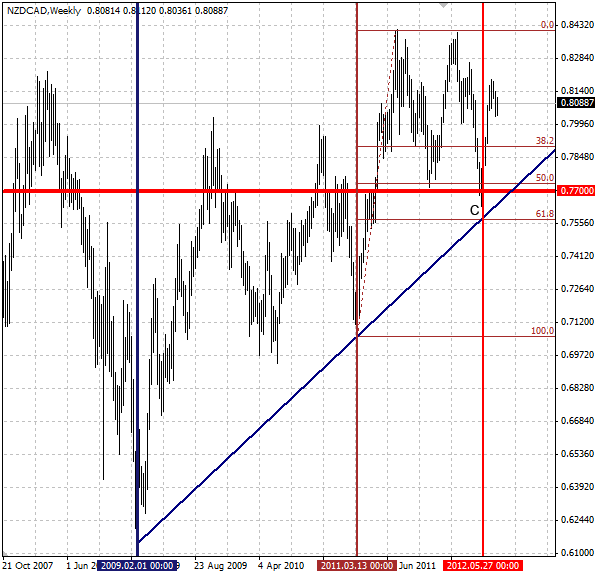
NZD/CAD" title="NZD/CAD" width="595" height="574">

Latest comments

Loading next article…
Risk Disclosure: Trading in financial instruments and/or cryptocurrencies involves high risks including the risk of losing some, or all, of your investment amount, and may not be suitable for all investors. Prices of cryptocurrencies are extremely volatile and may be affected by external factors such as financial, regulatory or political events. Trading on margin increases the financial risks.
Before deciding to trade in financial instrument or cryptocurrencies you should be fully informed of the risks and costs associated with trading the financial markets, carefully consider your investment objectives, level of experience, and risk appetite, and seek professional advice where needed.
Fusion Media would like to remind you that the data contained in this website is not necessarily real-time nor accurate. The data and prices on the website are not necessarily provided by any market or exchange, but may be provided by market makers, and so prices may not be accurate and may differ from the actual price at any given market, meaning prices are indicative and not appropriate for trading purposes. Fusion Media and any provider of the data contained in this website will not accept liability for any loss or damage as a result of your trading, or your reliance on the information contained within this website.
It is prohibited to use, store, reproduce, display, modify, transmit or distribute the data contained in this website without the explicit prior written permission of Fusion Media and/or the data provider. All intellectual property rights are reserved by the providers and/or the exchange providing the data contained in this website.
Fusion Media may be compensated by the advertisers that appear on the website, based on your interaction with the advertisements or advertisers.
© 2007-2025 - Fusion Media Limited. All Rights Reserved.