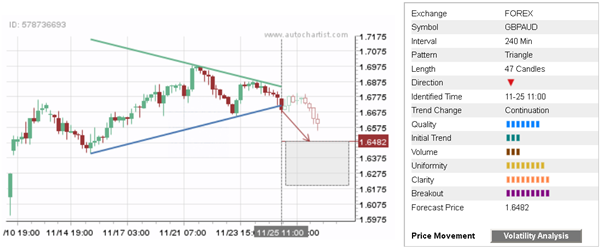
GBP/AUD continues to fall after the earlier breakout of the triangle chart pattern which was recently identified by Autochartist on the 4-hour charts. Autochartist rates the quality of this triangle at the 7 bar level – which reflects the slow initial trend (3 bars) and high uniformity and clarity (rated at the 8 and 9 bar levels respectively). Autochartist rates the strength of this breakout at 9-bar level. GBP/AUD is expected to soon reach the forecast price 1.6482.

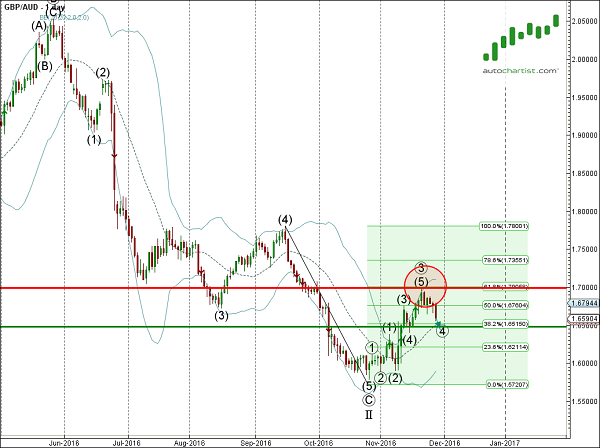
As can be seen from the following daily GBP/AUD chart, the top of this triangle formed when the pair reversed down from the resistance zone lying between the round resistance level 1.7000, upper daily Bollinger Band® and the 61.8% Fibonacci correction of the downward impulse from September. The proximity of this resistance zone adds to the likelihood GBP/AUD will soon reach the forecast price 1.6482.

