Investing.com’s stocks of the week
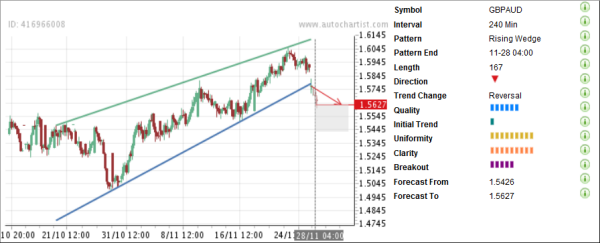
GBP/AUD continues to decline after the recent completion of the Rising Wedge chart pattern identified previously by Autochartist on the 4-hour charts. The overall Quality of this chart pattern is rated at the 6 bar level which reflects the following values of the contributing Quality indicators: low Initial Trend (one bar), and near maximum Uniformity and Clarity (both rated at the 9 bar level). The pair has recently broken through the lower support trendline of this chart pattern – falling down sharply to the upper boundary of the price Forecast Area located between price levels 1.5426 and 1.5627. The pair is set to fall further in the coming sessions.

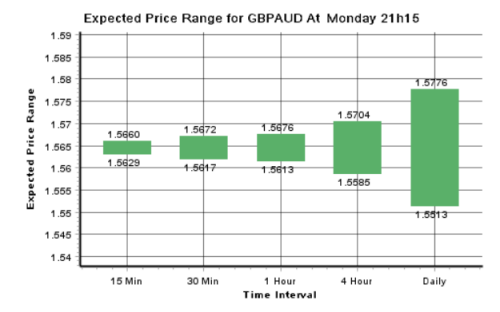
Selling at the level of the above Breakout would require placing the stop-loss at the distance equal up to 2 EPRs (Expected Price Range, a measure of price volatility calculated separately for each time-frame chart) above the entry. As you can see on the following PowerStats chart below, one EPR for the 4-hour GBP/AUD chart is equal to 119 pips.


Selling at the level of the above Breakout would require placing the stop-loss at the distance equal up to 2 EPRs (Expected Price Range, a measure of price volatility calculated separately for each time-frame chart) above the entry. As you can see on the following PowerStats chart below, one EPR for the 4-hour GBP/AUD chart is equal to 119 pips.

