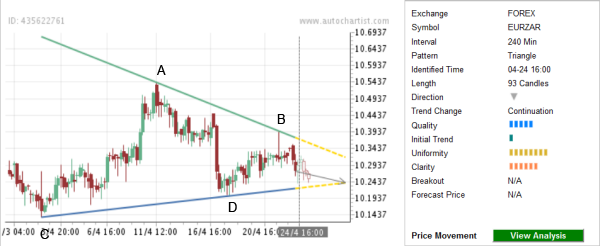
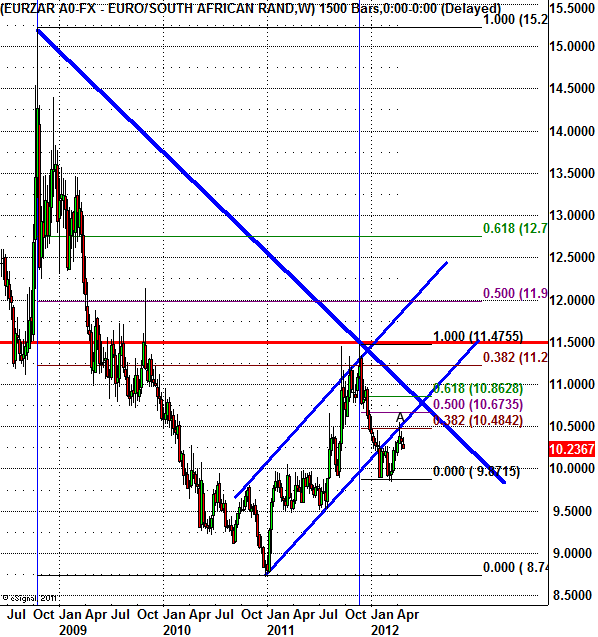
EUR/ZAR continues to fall inside the Uniform Triangle chart pattern identified by Autochartist on the 4-hour charts. The overall Quality of this chart pattern is rated at the 5 bar level as a result of the low Initial Trend (rated at the one bar level), near maximum Uniformity (8 bars) and above-average Clarity (6 bars). This chart pattern continues the overriding multi-year downtrend visible on the daily and the weekly EUR/ZAR charts. More specifically, this Triangle follows the preceding sharp weekly downward price impulse from the major resistance at 11.50, standing close to the 38,2% Fibonacci Retracement of the previous long-term downward price-move from the October of 2008. The top of this chart pattern (point A on the chart below) formed when the pair reversed down from the 38.2% Fibonacci Correction of the aforementioned preceding weekly downward price impulse from 11.50. The pair is expected to fall further in the nearest time.

The following weekly EUR/ZAR chart shows the longer-term picture of this currency pair’s movement:


The following weekly EUR/ZAR chart shows the longer-term picture of this currency pair’s movement:

