
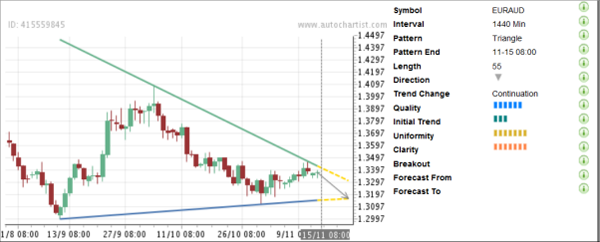
EUR/AUD is trending down inside the well-formed Triangle chart pattern identified by Autochartist on the daily charts. Autochartist rates the Quality of this Triangle at the above average 6 bar level, which is the result of the lower Initial Trend (measured at the 3 bar level) and significant Uniformity and Clarity (both rated at the 7 bar level). This chart pattern continues the long-term overriding downtrend that can be seen on the daily, weekly and the monthly EUR/AUD charts. The pair is expected to fall further in the nearest time, which is also indicated by the Key Levels forecast and the PowerStats analysis shown below.
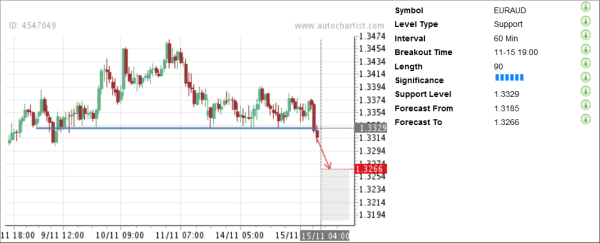
As can be seen from the following hourly Key Levels chart, EUR/AUD has recently broken through the horizontal Support level 1.3329 (with Significance rated at the 6 bar level) identified previously by Autochartist. The pair is expected to fall further in the direction of the Forecast Region located between price levels 1.3185 and 1.3266.
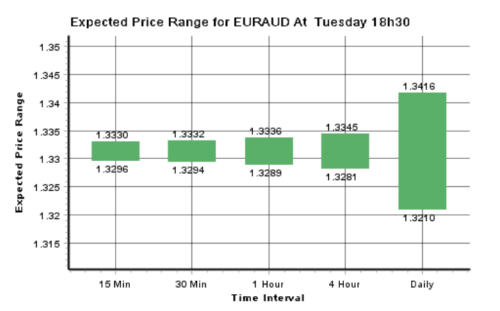
As you can see from the PowerStats chart below, nearly all of the daily Expected Price Range for EUR/AUD for tomorrow (from 1.3416 to 1.3210) lies below the upper resistance trendline of this Triangle – which increases the probability that this pair will continue to fall tomorrow.
As can be seen from the following hourly Key Levels chart, EUR/AUD has recently broken through the horizontal Support level 1.3329 (with Significance rated at the 6 bar level) identified previously by Autochartist. The pair is expected to fall further in the direction of the Forecast Region located between price levels 1.3185 and 1.3266.
As you can see from the PowerStats chart below, nearly all of the daily Expected Price Range for EUR/AUD for tomorrow (from 1.3416 to 1.3210) lies below the upper resistance trendline of this Triangle – which increases the probability that this pair will continue to fall tomorrow.