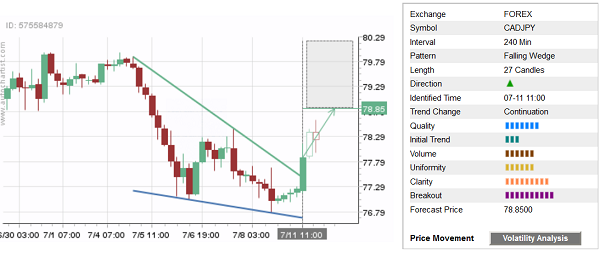
Autochartist recently identified the breakout of the 4-hour Falling Wedge on the 4-hour CAD/JPY charts. The overall Quality of this chart pattern is measured at the 7 bar level – which is the result of the low Initial Trend (2 bars), above-average Uniformity (6 bars) and near-maximum Clarity (9 bars). Autochartist rates the strength of this breakout at the maximum, 10-bar level – which adds to the probability the pair will soon reach the Forecast Price 78.85.

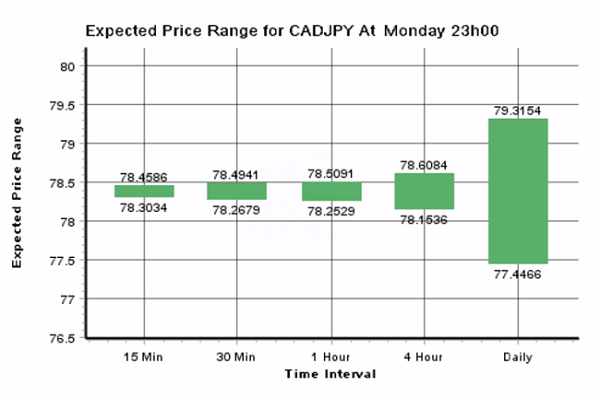
As you can see from the PowerStats chart below – the upper boundary of the daily Expected Price Range calculated by Autochartist for this currency pair (79.31) exceeds the Forecast Price calculated for the breakout of this Falling Wedge (78.85) – which adds to the likelihood the pair will continue to rise tomorrow.

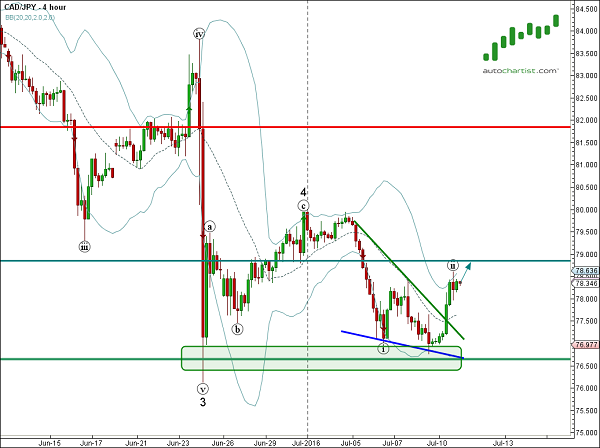
As you can see from the daily CAD/JPY chart below, the bottom of this Falling Wedge formed near the pivotal support level 76.70 (which stopped earlier sharp impulse wave 3 in June). The proximity of this support level increases the probability of further gains for this currency pair.

