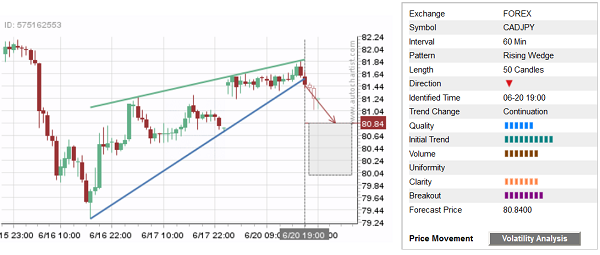
CAD/JPY continues to fall – after the recent breakout of the Rising Wedge chart pattern which was previously identified by Autochartist on the hourly charts. The overall Quality for this chart pattern is measured by Autochartist at the 6 bar level – which reflects sharp Initial Trend (rated at the maximum, 10-bar level) and significant Clarity (7 bars). Autochartist rates the strength of this Breakout at the 8-bar level. AUD/JPY is likely to fall to the Forecast Price 80.840 in the nearest time.

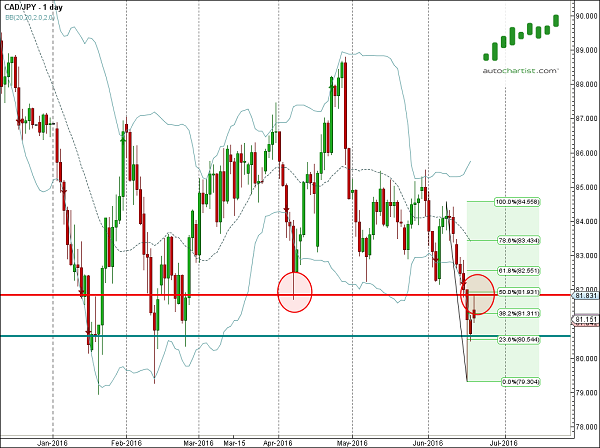
As can be seen from the hourly CAD/JPY chart below, the top of this Rising Wedge formed when the pair reversed down from the strong resistance zone lying at the intersection of the resistance level 81.80 (former multi-month support from April) and 50% Fibonacci correction of the previous downward impulse from the start of June. The proximity of this resistance zone adds to the probability the price will soon reach the Forecast Price 80.840.

