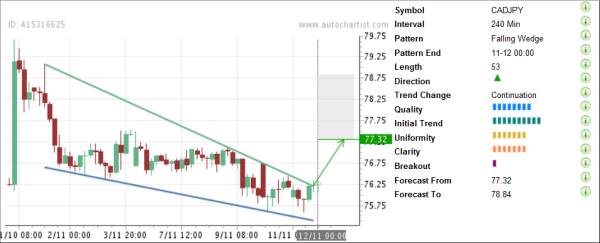
CAD/JPY has recently completed the high Quality Falling Wedge chart pattern identified by Autochartist on the 4-hour charts. Autochartist rates the overall Quality of this chart pattern at the 8 bar level as a result of the strong values of all the contributing Quality indicators: maximum Initial Trend (rated at the 10 bar level) and significant Uniformity and Clarity (both rated at the 7 bar level). This chart pattern continues the previous sharp upward impulse (whose strength is reflected by the maximum Initial Trend value of this Falling Wedge) from the major long-term support 72.00, which had previously reversed the strong downtrend in 2008 (as is shown on the second chart below). The pair is expected to continue upward movement in the nearest time – in the direction of the Forecast Area located between price levels 77.32 and 78.84.

The following monthly CAD/JPY chart shows previous price action close to the major support 72.00:


The following monthly CAD/JPY chart shows previous price action close to the major support 72.00:

