
CAD/CHF has recently completed the Rising Wedge chart pattern identified by Autochartist on the 30-minute charts. The overall Quality of this chart pattern is measured at the 7 bar level, as a result of the above-average Initial Trend (rated at the 6 bar level) and near maximum Uniformity and Clarity (both rated at the 8 bar level). This chart pattern develops in line with the prevailing downtrend that can be seen on the daily and the weekly CAD/CHF charts. The top of this chart pattern (point E on the chart below) formed when the pair reversed down from the major resistance 0.9000. This downward reversal led to the Breakout (whose strength is measured at the 9 bar level) of the lower support trendline. The pair is expected to continue downward movement in the direction of the Forecast Area set between price levels 0.8822 and 0.8905.

As can be seen from the following 15-minute Key Levels chart for CAD/CHF, the pair is trading close to the horizontal Support level 0.8937 (with Significance rated at the 4 bar level). This level should be broken for the pair to fall further.
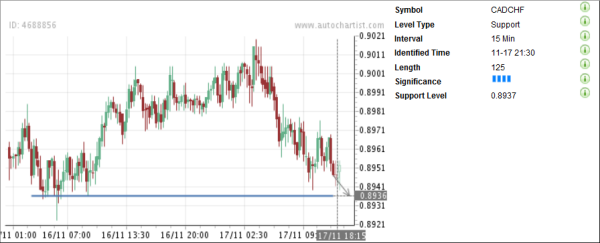
As can be seen from the following 15-minute Key Levels chart for CAD/CHF, the pair is trading close to the horizontal Support level 0.8937 (with Significance rated at the 4 bar level). This level should be broken for the pair to fall further.