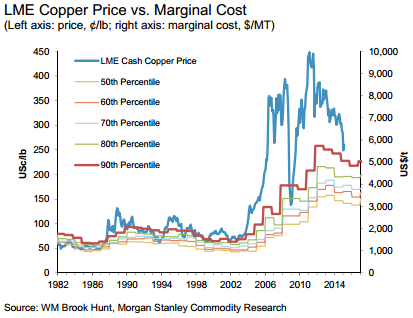
1. Copper Marginal Cost Percentiles

The 90th percentile cost of producing copper is currently roughly $2.25/lb, it’s interesting that this level also coincides with the 200-month moving average (the same moving average where copper found support at the 2008-2009 lows).
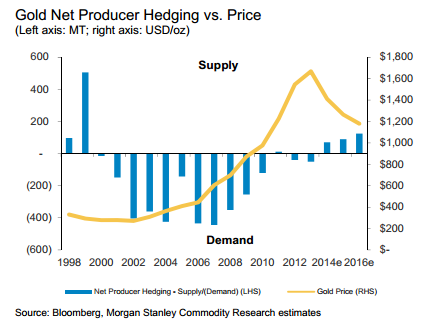
2.Gold Net Producer Hedging
A powerful chart of gold net producer hedging since the late 90s. It’s not a coincidence that producers have begun hedging at an expanding rate in the past couple of years as the gold price has cratered. Incidentally, the last time that producers were hedging this much, it turned out to be an excellent buying opportunity in gold:

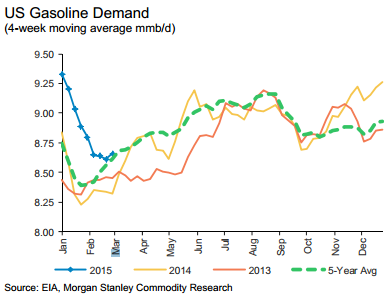
3. US Gasoline Demand

Gasoline demand has dropped drastically since the end of 2014 and is now back in line with the 5-year average after being well above it at the start of the year.
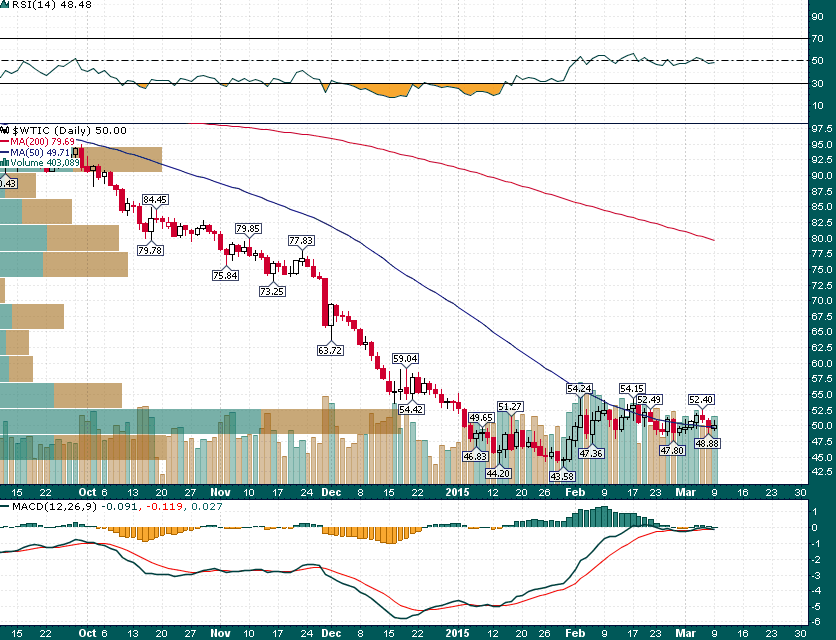
WTI Crude Oil (Daily)

It is fitting that WTI ended yesterday’s pit session exactly at $50.00 after gyrating all around this level for the past 6 weeks. Seasonal tailwinds, extreme bearish sentiment, and tremendous downside hedging continue to provide support during sell-offs while record US oil supplies and falling gasoline demand continue to weigh on price.
Disclosure: Commodity Chart Wrap 3/9/2015 via Energy and Gold.com