CL2G
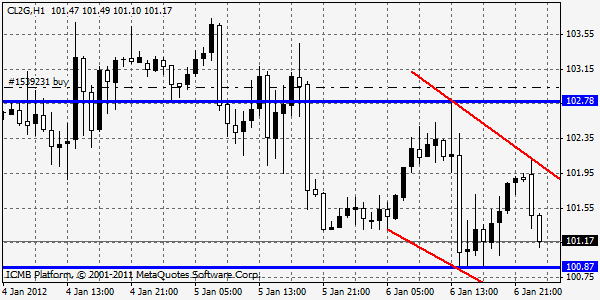
Oil slipped for a second day as speculation Europe is headed for a recession overshadowed concern that tensions with Iran may lead to a disruption in Middle East shipments. Futures decreased 0.3 percent as the euro dropped to the lowest level versus the dollar since September 2010. Crude surged to the highest price in almost eight months this week after Iran threatened to block the Strait of Hormuz and European ministers discussed an embargo on oil imports from the country. Crude oil for February delivery fell 25 cents to $101.56 a barrel on the New York Mercantile Exchange, the lowest settlement since Dec. 30. The contract climbed 2.8 percent this week. Prices advanced 8.2 percent in 2011. Western countries have imposed sanctions on Iran because they allege the country’s nuclear-development program is aimed at building atomic weapons. Iran says the plans are for civilian purposes and to generate electricity. The Iranian Revolutionary Guard Corps will hold large-scale exercises in the Strait of Hormuz and the Persian Gulf next month. The country, the third-largest oil exporter globally, has threatened to shut the Strait of Hormuz, a transit route for almost a fifth of the world’s oil. There’s no question that blocking the Strait of Hormuz would cause a price spike but there’s a growing realization that it would be difficult for Iran to close it for any length of time. It is really senseless for them to close it.
GOLD
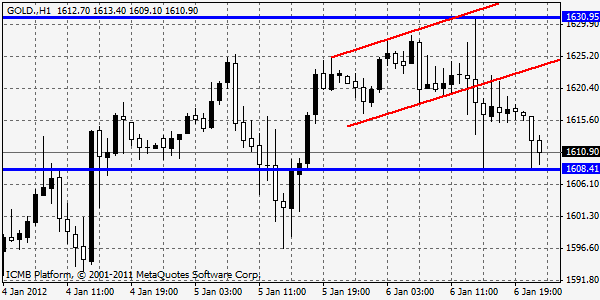
Gold traders are the most bullish in a month as Europe’s deepening debt crisis and increasing tensions over Iran drove the metal to its longest winning streak since October. The metal traded at $1,618.28 an ounce p.m. in London, fell almost 19 percent from its record closing price of $1,900.23 on Sept. 5 through Dec. 29 within 1 percentage point of the common definition of a bear market. Gold rallied 5 percent in five days ended last Thursday, the longest run of gains since October. February Gold settled at $1616.50 per troy ounce, a loss of $3.30 for the day. Gold traded mildly lower on the day as the dollar continued to rally. Traders noted moderately upbeat December payrolls and a decline in U.S. unemployment rate but Europe remains the primary driver of this market. After four days of gains, gold recorded a small loss last Friday. Investors are active and volumes have firmed after vanishing for the Holiday. How gold behaves above 1629 will be the first great test for this rally and its staying power. We suspect the December sell-off has inflicted lasting technical damage on this market and that Gold is likely to experience selling from 1630-1670. A settlement above this likely congestion zone could signal the start of a more lasting reversal. If gold does fail on its next leg higher however we project it will retest the December low of 1523.90 and from there our next objective to the downside is 1486. This rally may not be ready to throw in the towel just yet but as an early indication, we think it is showing signs of fatigue. 
- English (UK)
- English (India)
- English (Canada)
- English (Australia)
- English (South Africa)
- English (Philippines)
- English (Nigeria)
- Deutsch
- Español (España)
- Español (México)
- Français
- Italiano
- Nederlands
- Português (Portugal)
- Polski
- Português (Brasil)
- Русский
- Türkçe
- العربية
- Ελληνικά
- Svenska
- Suomi
- עברית
- 日本語
- 한국어
- 简体中文
- 繁體中文
- Bahasa Indonesia
- Bahasa Melayu
- ไทย
- Tiếng Việt
- हिंदी
Daily Commodities Analysis: Oil and Gold
Published 01/09/2012, 07:50 AM
Updated 04/25/2018, 04:40 AM
Daily Commodities Analysis: Oil and Gold
Latest comments
Loading next article…
Install Our App
Risk Disclosure: Trading in financial instruments and/or cryptocurrencies involves high risks including the risk of losing some, or all, of your investment amount, and may not be suitable for all investors. Prices of cryptocurrencies are extremely volatile and may be affected by external factors such as financial, regulatory or political events. Trading on margin increases the financial risks.
Before deciding to trade in financial instrument or cryptocurrencies you should be fully informed of the risks and costs associated with trading the financial markets, carefully consider your investment objectives, level of experience, and risk appetite, and seek professional advice where needed.
Fusion Media would like to remind you that the data contained in this website is not necessarily real-time nor accurate. The data and prices on the website are not necessarily provided by any market or exchange, but may be provided by market makers, and so prices may not be accurate and may differ from the actual price at any given market, meaning prices are indicative and not appropriate for trading purposes. Fusion Media and any provider of the data contained in this website will not accept liability for any loss or damage as a result of your trading, or your reliance on the information contained within this website.
It is prohibited to use, store, reproduce, display, modify, transmit or distribute the data contained in this website without the explicit prior written permission of Fusion Media and/or the data provider. All intellectual property rights are reserved by the providers and/or the exchange providing the data contained in this website.
Fusion Media may be compensated by the advertisers that appear on the website, based on your interaction with the advertisements or advertisers.
© 2007-2025 - Fusion Media Limited. All Rights Reserved.
