
Stocks in focus!
Equities got the most attention overnight as the US stock market fell sharply and closed near its lows for the day (-1.3% on the S&P 500). The market was led down by two sectors: oils (-1.9%), which have been falling along with the price of crude, and retailers (-1.5%). A Wall Street Journal story noted a survey showing that all but one apparel retailer missed forecasts in December and observed that this may bode ill for today’s US retail sales figure. The WSJ story said this “may encourage a more cautious approach on easing stimulus efforts,” which hurt the USD. On the other hand, Atlanta Fed President Lockhart (a non-voting member of the FOMC) said he hadn’t changed his view on tapering off the Fed’s bond-buying program, echoing what St. Louis Fed President Bullard said on Friday. That raised the likelihood of further tapering at this month’s FOMC meeting – bad for stocks perhaps, but USD-supportive. USD recovered much of its losses and this morning is trading higher against most G10 and EM currencies.
The dollar’s biggest gain overnight was against GBP, which fell largely on further position-cutting after last week’s disappointing industrial production data. I continue to believe in the long GBP trade and see this technical decline as an opportunity to establish new longs, particularly in GBP/CAD, which saw a large shake-out of positions yesterday. The Bank of Canada’s quarterly Business Outlook Survey showed that business expansion plans are being restrained by weak demand, but nonetheless the balance of opinion for investment intentions and employment rose, refuting to some degree the disappointing employment data last week. Still, I believe expectations for the UK economy will continue to exceed those for Canada and GBP is likely to gain on CAD, in my view.
On the other hand, USD fell vs NZD as New Zealand business confidence surged to almost a 20-year high and house prices rose the most in six years, increasing the likelihood of a rate hike. New Zealand is the only G10 country with a distinctly hawkish central bank view and I expect NZD to continue to benefit from this fact, particularly vs AUD.
The focus in European time today will be on CPIs. We get December CPIs from France, Sweden, Italy and the UK. In the Eurozone, French CPI is expected to have risen 0.4% mom in December vs an unchanged figure in November, while Italy’s final release for the month is the same as the initial estimate at +0.6% yoy. ECB President Draghi commented that the drop in inflation in the Eurozone in December according to the preliminary data was due largely to a technical change in the statistics in Germany. There may be more attention than usual paid to the French and Italian data in order to see whether the trend of slowing inflation is in fact gaining traction in the Eurozone. UK inflation is estimated to be up +0.5% mom, an acceleration from +0.1% mom. This will keep the yoy at 2.1%, pretty close to the 2% inflation target of BoE, and allow the Bank of England to keep rates lower for longer – hence potentially GBP-negative if it’s not already discounted in the market. Meanwhile UK PPI is estimated to have shown no change on a mom basis in December, compared with -0.2% mom in November. Also, Eurozone’s industrial production for November is expected to have risen 1.4% mom, a turnaround from -1.1% mom in October.
In the US, retail sales for December are expected to slow to +0.1% mom from +0.7% mom in November. The retail sales excluding autos and gasoline are also forecast to slow to +0.3% mom from +0.6% mom in November. Over the last 12 months the figure has not been that market-affecting for EUR/USD, particularly on the day of the announcement. Oddly enough, on average EUR/USD has declined (= USD has strengthened) in the week following retail sales regardless of whether it beat estimates or not, which suggests that other factors, such as tapering, might have been in play. 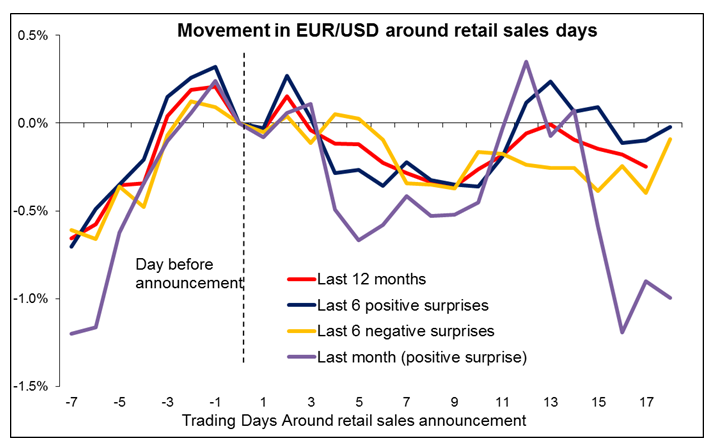 EUR/USD Retail Movement Chart" title="EUR/USD Retail Movement Chart" width="712" height="444">
Finally, ECB governing council member Ewald Nowotny gives a keynote speech at a conference. Philadelphia Fed President Plosser and Dallas Fed President Fisher will also speak. If they too come out in favor of continuing with the taper, then all doubt should dissipate. That could outweigh a weak retail sales figure and prove USD-supportive.
The Market
EUR/USD 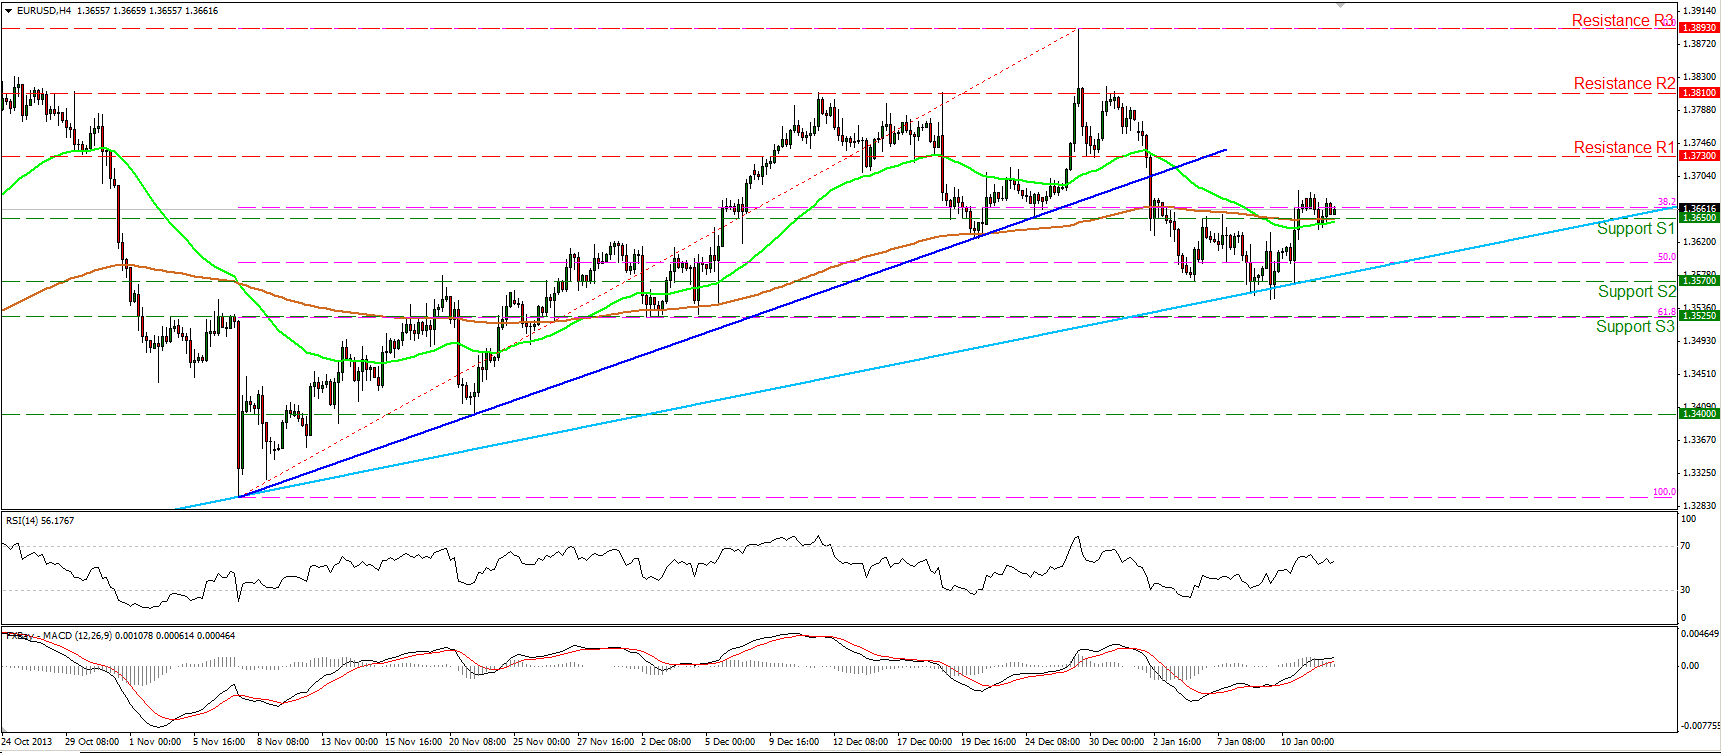 EUR/USD 4 Hour Chart" title="EUR/USD 4 Hour Chart" width="712" height="444">
The EUR/USD moved sideways on Monday, remaining slightly above the barrier of 1.3650 (S1). This leaves the longer-term uptrend intact for now. We may experience a further advance over the next few days, but as long as the peak of 1.3810 (R2) holds, the possibility for the formation of a lower high still exists. Only a break below the 1.3525 (S3), which coincides with the 61.8% Fibonacci retracement level of the 7th Nov. – 27th Dec. advance, would suggest that the longer term uptrend has probably reached its end.
Support: 1.3650 (S1), 1.3570 (S2), 1.3525 (S3).
Resistance: 1.3730 (R1), 1.3810 (R2), 1.3893 (R3).
USD/JPY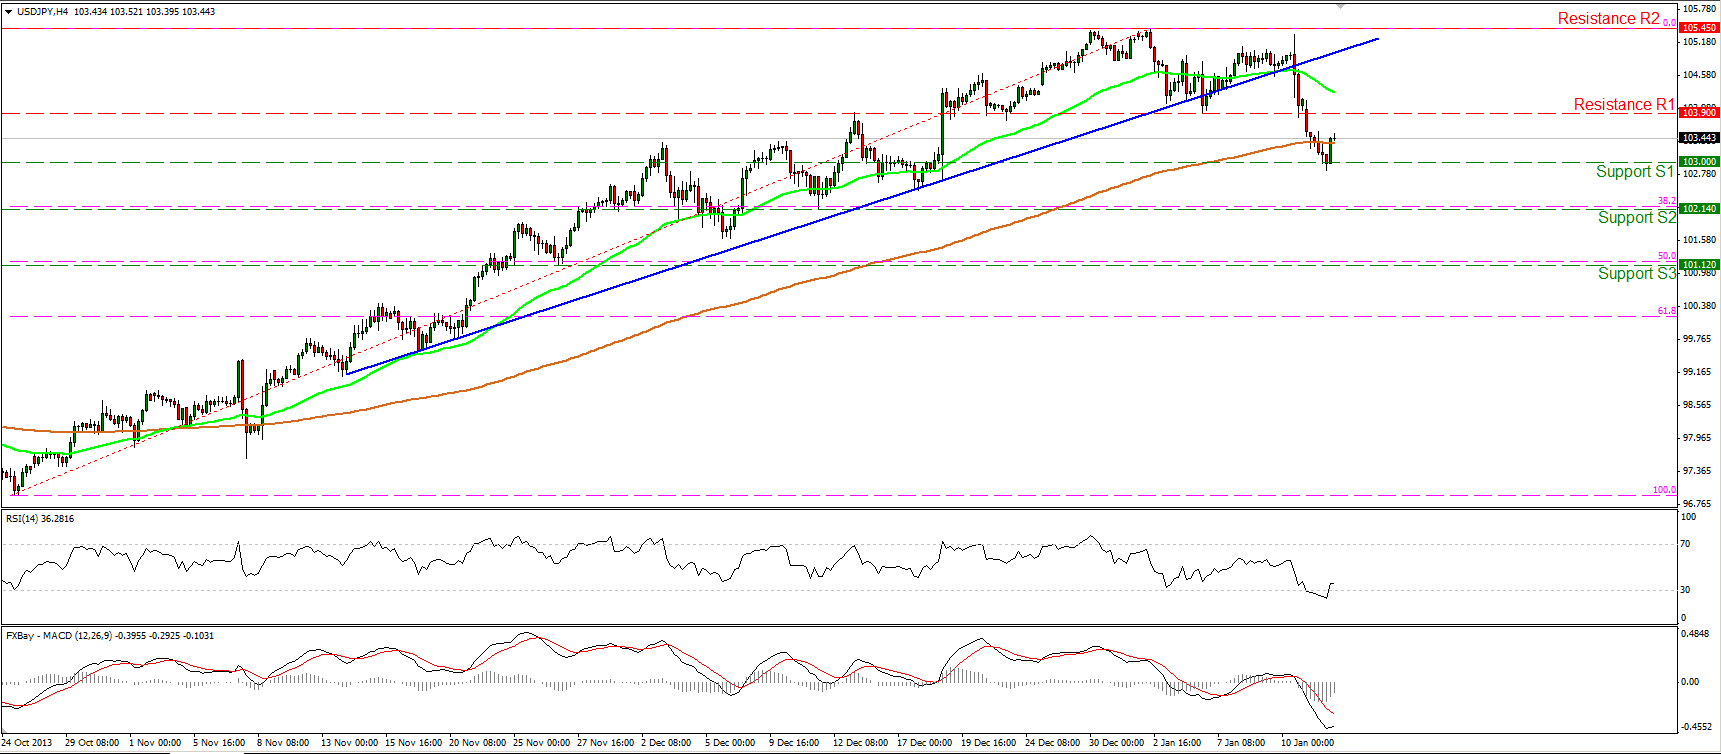 USD/JPY 4 Hour Chart" title="USD/JPY 4 Hour Chart" width="712" height="444">
The USD/JPY moved significantly lower, breaking below the blue uptrend line and the 103.90 level. The pair found support at the 103.00 (S1) barrier and then moved slightly higher. A decisive dip below 103.00 (S1) may challenge the next support at 102.14 (S2), which coincides with the 38.2% Fibonacci retracement level of the prevailing short-term uptrend. On the daily chart, the daily MACD, although in a bullish territory, lies below its trigger line, increasing the odds for further decline.
Support: 103.00 (S1), 102.14 (S2), 101.12 (S3).
Resistance: 103.90 (R1), 105.45 (R2), 107.00 (R3).
EUR/GBP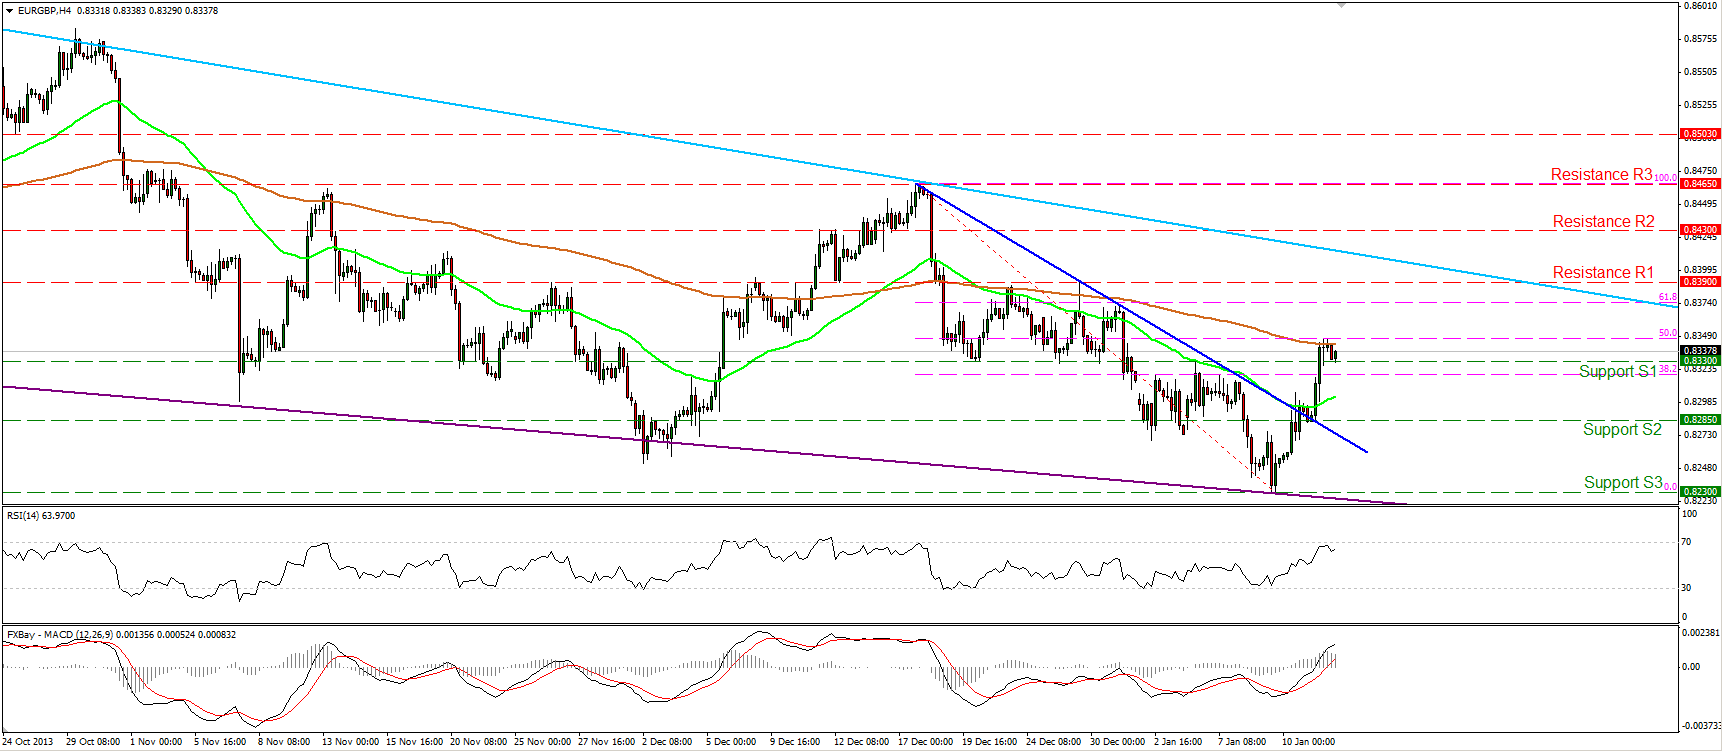 EUR/GBP 4 Hour Chart" title="EUR/GBP 4 Hour Chart" width="712" height="444">
The EUR/GBP moved higher after rebounding from the purple support line (connecting the lows on the daily chart) but the advance was halted by the 50% retracement level of the 17th Dec. – 9th Jan. decline. A violation of that barrier may signal further bullish extensions and target the light blue longer-term downtrend line, near the 0.8400 area. The MACD indicator lies above both its trigger and zero lines, confirming the bullish momentum of the price action.
I would consider the bias to the downside again upon a fall below the low of 0.8230 (S3).
Support: 0.8330 (S1), 0.8285 (S2), 0.8230 (S3).
Resistance: 0.8390 (R1), 0.8430 (R2), 0.8465 (R3).
Gold
Gold moved in a consolidative mode, remaining near the area of the 1252 (R1) resistance barrier. If the longs manage to drive the metal above that resistance, I would expect them to challenge the next hurdle at 1268 (R2). The 50-period moving average is getting closer to the 200-period moving average and a bullish cross in the near future may increase the probabilities for further advance. The RSI exited its overbought zone, thus a pullback before the bulls prevail again cannot be ruled out. On the daily and weekly charts, the longer-term downtrend remains in effect, and as a result I would consider any short-term advance as a retracement of the major downward path for now.
Support: 1224 (S1), 1187 (S2), 1155 (S3).
Resistance: 1252 (R1), 1268 (R2), 1290 (R3).
Oil
WTI moved lower on Monday and found support at the 91.50 (S1) barrier. A break below that level may signal the continuation of the decline and challenge as a first target the next support at 90.15 (S2). Nonetheless, both momentum studies follow upward paths, thus we may experience an upward corrective wave before the bears take control again. The 50-period moving average lies below the 200-peroid moving average, keeping the outlook of the oil negative at the moment.
Support: 91.50 (S1), 90.15 (S2), 87.85 (S3).
Resistance: 93.30 (R1), 94.00 (R2), 95.35 (R3).
BENCHMARK CURRENCY RATES - DAILY GAINERS AND LOSERS
MARKETS SUMMARY
Disclaimer: This information is not considered as investment advice or investment recommendation but instead a marketing communication. This material has not been prepared in accordance with legal requirements designed to promote the independence of investment research, and that it is not subject to any prohibition on dealing ahead of the dissemination of investment research. IronFX may act as principal (i.e. the counterparty) when executing clients’ orders. This material is just the personal opinion of the author(s) and client’s investment objective and risks tolerance have not been considered. IronFX is not responsible for any loss arising from any information herein contained. Past performance does not guarantee or predict any future performance.
Redistribution of this material is strictly prohibited. Risk Warning: Forex and CFDs are leveraged products and involves a high level of risk. It is possible to lose all your capital. These products may not be suitable for everyone and you should ensure that you understand the risks involved. Seek independent advice if necessary. IronFx Financial Services Limited is authorised and regulated by CySEC (Licence no. 125/10). IronFX UK Limited is authorised and regulated by FCA (Registration no. 585561). IronFX (Australia) Pty Ltd is authorized and regulated by ASIC (AFSL no. 417482)
- English (UK)
- English (India)
- English (Canada)
- English (Australia)
- English (South Africa)
- English (Philippines)
- English (Nigeria)
- Deutsch
- Español (España)
- Español (México)
- Français
- Italiano
- Nederlands
- Português (Portugal)
- Polski
- Português (Brasil)
- Русский
- Türkçe
- العربية
- Ελληνικά
- Svenska
- Suomi
- עברית
- 日本語
- 한국어
- 简体中文
- 繁體中文
- Bahasa Indonesia
- Bahasa Melayu
- ไทย
- Tiếng Việt
- हिंदी
Daily Commentary: US Stocks Feel Sharply
Published 01/14/2014, 07:14 AM
Updated 07/09/2023, 06:31 AM
Daily Commentary: US Stocks Feel Sharply
Latest comments
Loading next article…
Install Our App
Risk Disclosure: Trading in financial instruments and/or cryptocurrencies involves high risks including the risk of losing some, or all, of your investment amount, and may not be suitable for all investors. Prices of cryptocurrencies are extremely volatile and may be affected by external factors such as financial, regulatory or political events. Trading on margin increases the financial risks.
Before deciding to trade in financial instrument or cryptocurrencies you should be fully informed of the risks and costs associated with trading the financial markets, carefully consider your investment objectives, level of experience, and risk appetite, and seek professional advice where needed.
Fusion Media would like to remind you that the data contained in this website is not necessarily real-time nor accurate. The data and prices on the website are not necessarily provided by any market or exchange, but may be provided by market makers, and so prices may not be accurate and may differ from the actual price at any given market, meaning prices are indicative and not appropriate for trading purposes. Fusion Media and any provider of the data contained in this website will not accept liability for any loss or damage as a result of your trading, or your reliance on the information contained within this website.
It is prohibited to use, store, reproduce, display, modify, transmit or distribute the data contained in this website without the explicit prior written permission of Fusion Media and/or the data provider. All intellectual property rights are reserved by the providers and/or the exchange providing the data contained in this website.
Fusion Media may be compensated by the advertisers that appear on the website, based on your interaction with the advertisements or advertisers.
© 2007-2025 - Fusion Media Limited. All Rights Reserved.