class="the-big-picture">Same story, same ending:
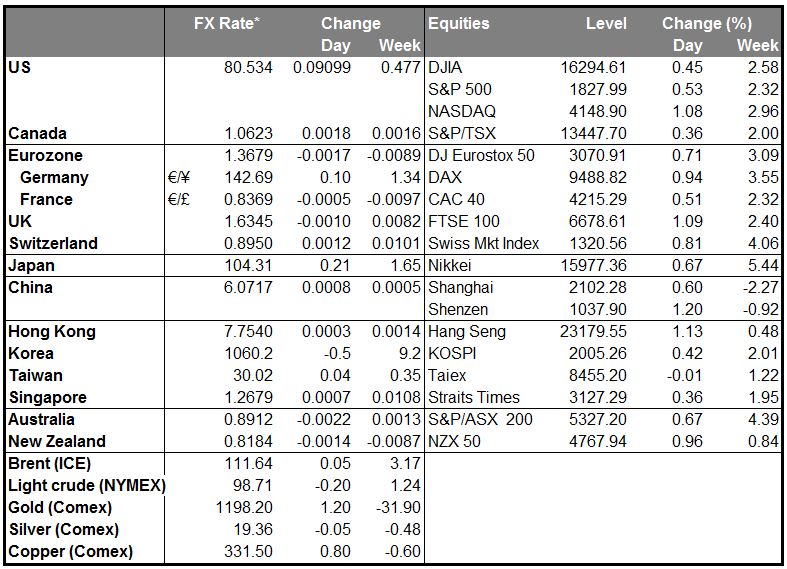
Once again solid US economic news sent stocks higher and Fed Funds implied interest rates higher, but largely left the dollar behind. It was higher this morning against AUD, JPY and NZD and lower against SEK, CAD, NOK and CHF.
Nominal personal consumption expenditures (PCE) were up +0.5% in Nov after upward revisions, although personal income was only up +0.2%, meaning the gap was made up from savings: the savings rate declined -0.3% to +4.2%. This level of spending implies another strong 4Q GDP report in the order of 3% to 4%. The strong data has investors rethinking the likely course of Fed policy already and the implied interest rate on the far Fed Funds contracts were up another 8 bps. But the dollar generally weakened in New York trading nonetheless, apparently on end-year position-squaring. Given the strong indicators recently and the general rethink of Fed intentions – the market has now priced in one additional full rate hike by mid-2016 -- I would expect to see the dollar begin rallying strongly as soon as the end-year position-squaring ends and the New Year begins. Remember that for the USD/JPY at least, the lows for the year in 2013 were set on Jan. 2nd.
CAD gained on solid economic news. Canadian GDP for October, released yesterday, showed that the Canadian economy expanded by a faster-than-expected 0.3% in October, the fourth month in a row for expansion. Also there was some strength in household and business credit in November. However CAD couldn’t hold onto all the gains and the pair drifted back up, leaving CAD only slightly stronger on the day.
Activity yesterday was very thin – apparently it was largely over by midday in New York. It’s likely to e only thinner today. The economic calendar in Europe is almost empty: the only indicator coming out from Europe is France’s final GDP for Q3. The forecast is at -0.1% qoq, the same as the initial estimate.
In US, durable goods orders for November are coming out. The headline figure is expected to have risen by 2.0% mom, a turnaround from a revised -1.6% mom in October, while the excluding transportation release is estimated to have accelerated to +0.7% from a revised +0.4% the previous month. The US Federal Housing Finance Agency (FHFA) house price index is estimated to have risen by 0.5% in October, a faster pace than +0.3% in September, while new home sales for November are expected to have seen a fall of 0.9% mom, not surprising after October’s 25.4% mom rise. The Richmond Fed Manufacturing survey for December is expected to decline to 10 from 13. All told in theory this news should add to the view of a robust US economy and boost the dollar, but recently that doesn’t seem to be happening.
No comment tomorrow.
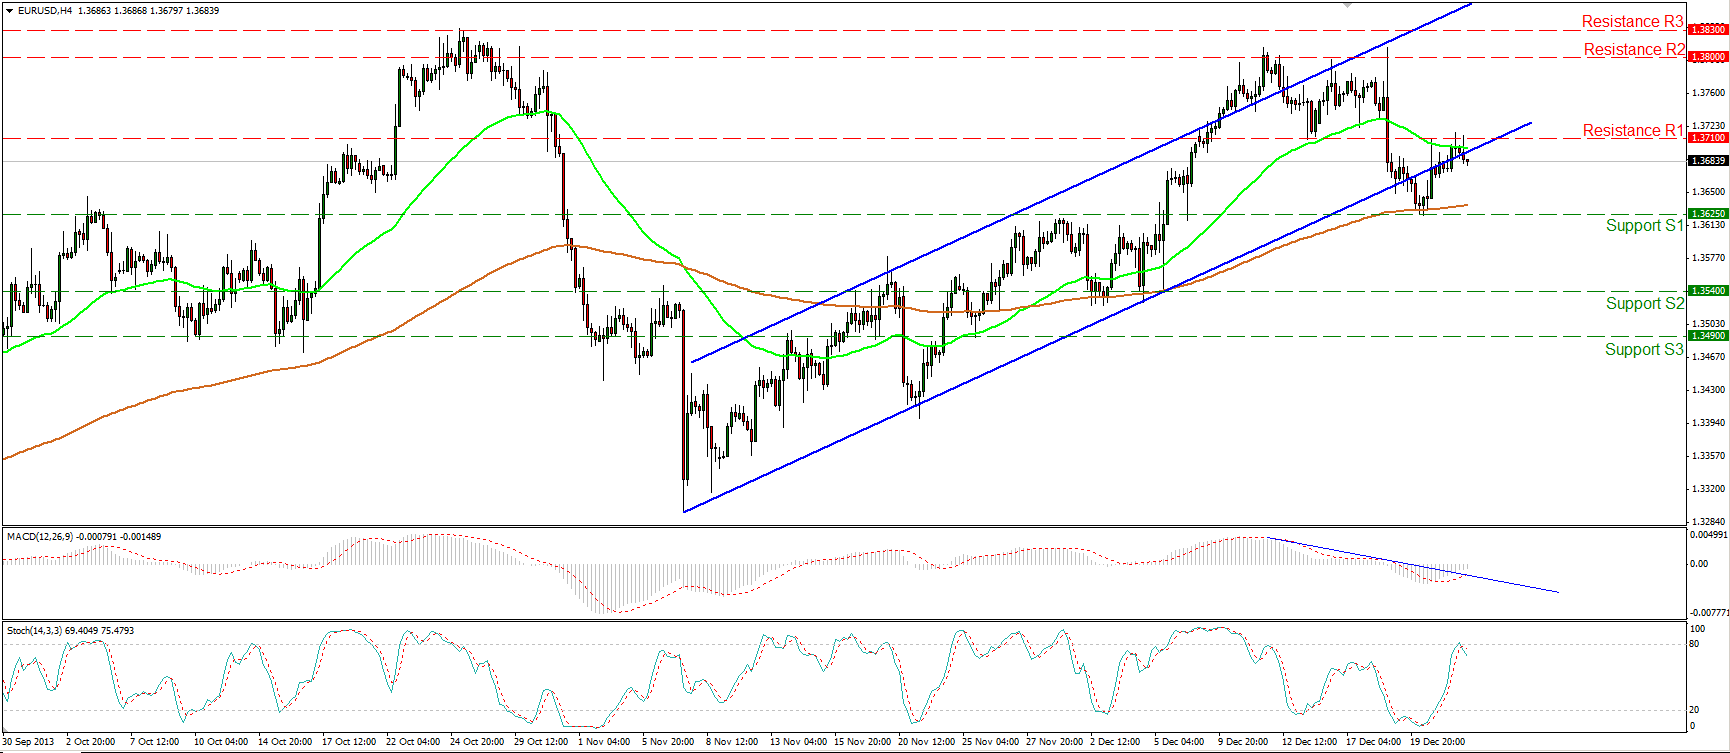
The EUR/USD hit the 1.3710 (R1) resistance level and moved lower, forming a lower high than the previous at 1.3800 (R2). A clear break below the 1.3625 (S1) hurdle would confirm a forthcoming lower low and we may see the bears targeting the next barrier at 1.3540 (S2). The MACD oscillator continues to follow a downward path, while the Stochastic found resistance near its 80 level and moved lower with the %K crossing below the %D.
• Support: 1.3625 (S1), 1.3540 (S2), 1.3490 (S3).
• Resistance: 1.3710 (R1), 1.3800 (R2), 1.3830 (R3).
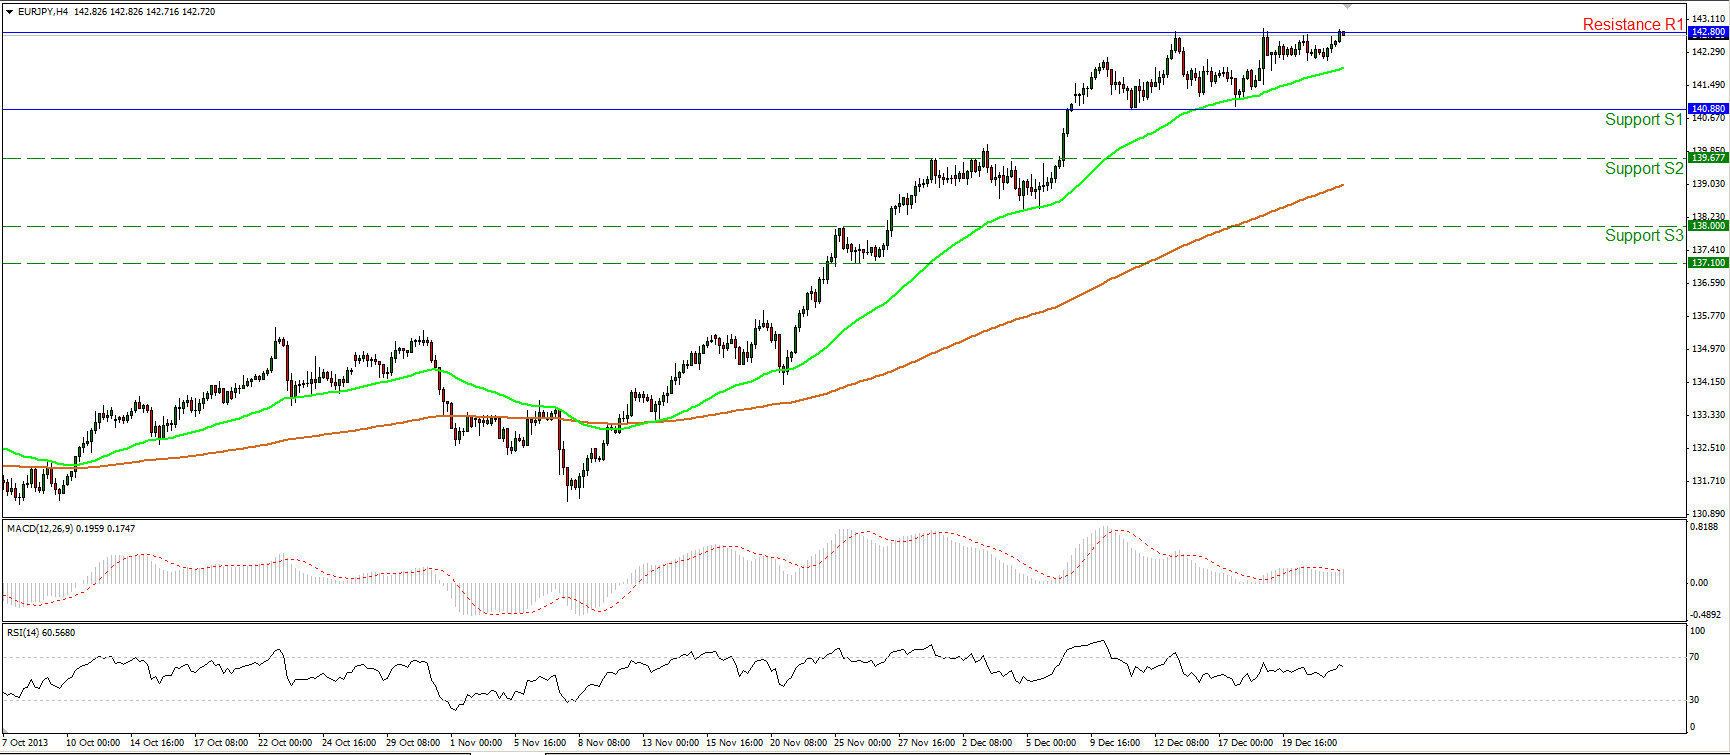
The EUR/JPY moved higher and seems ready to escape from its sideways path. The pair is currently testing the upper boundary of the range between the support of 140.88 (S1) and the resistance of 142.80 (R1). An upward break of that resistance would trigger bullish extensions towards the next barrier at 146.85 (R2). The 50-period moving average lies above the 200-period moving providing reliable support to the price action.
• Support: 140.88 (S1), 139.67 (S2), 138.00 (S3).
• Resistance: 142.80 (R1), 146.85 (R2), 148.75 (R3).
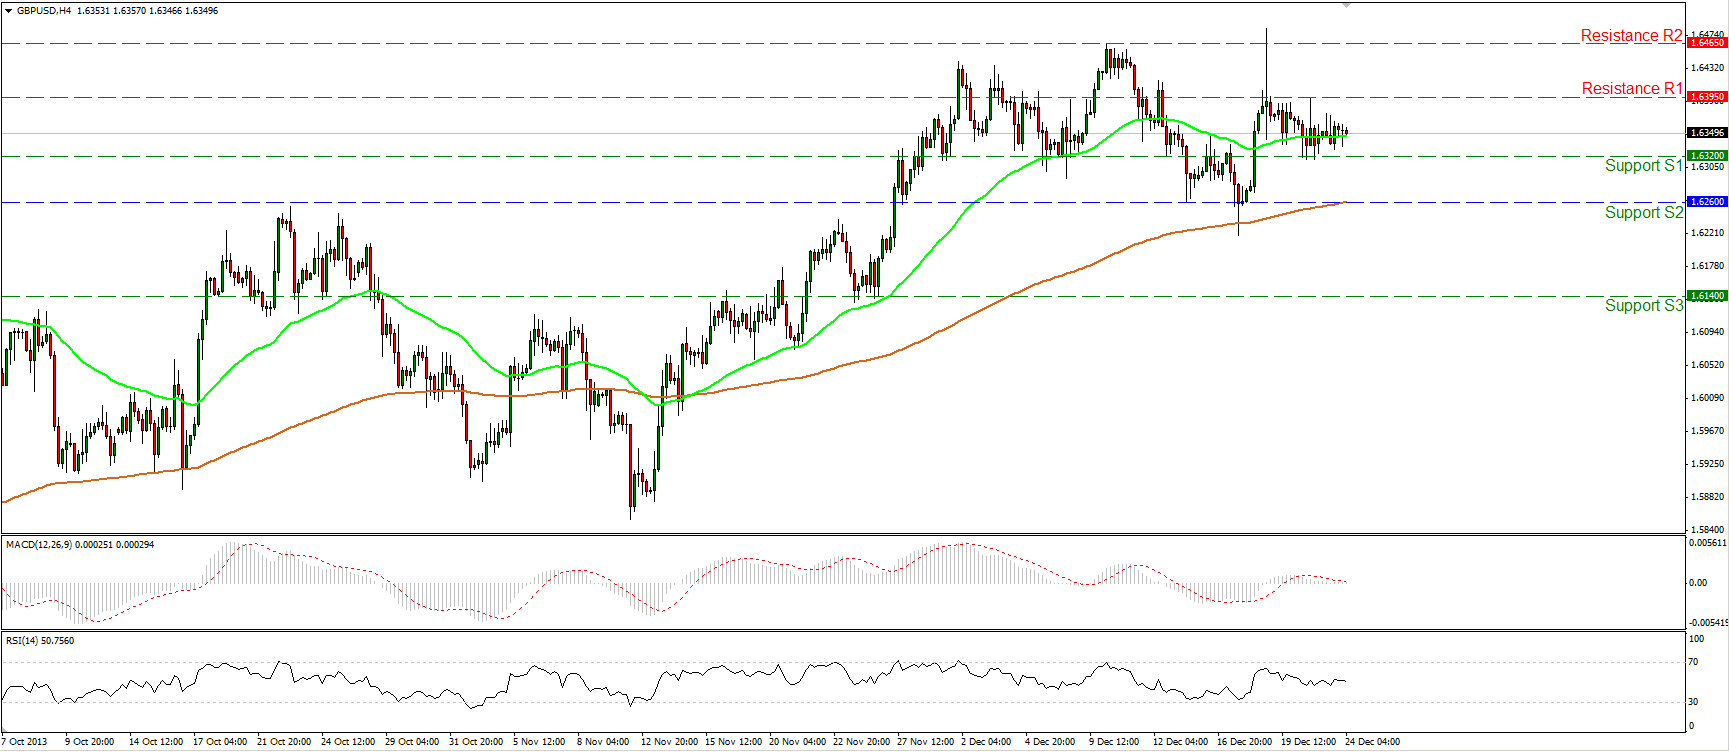
The GBP/USD continued consolidating between the support of 1.6320 (S1) and the resistance of 1.6395 (R1). I remain neutral on the pair since we need to see the rate overcoming the high of 1.6465 (R2) to assume a further advance, while it would take a dip below the 1.6260 (S2) key support to confirm a downtrend. Both momentum studies lie near their neutral levels confirming the sideways range of the currency pair.
• Support: 1.6320 (S1), 1.6260 (S2), 1.6140 (S3).
• Resistance: 1.6395 (R1), 1.6465 (R2), 1.6570 (R3).
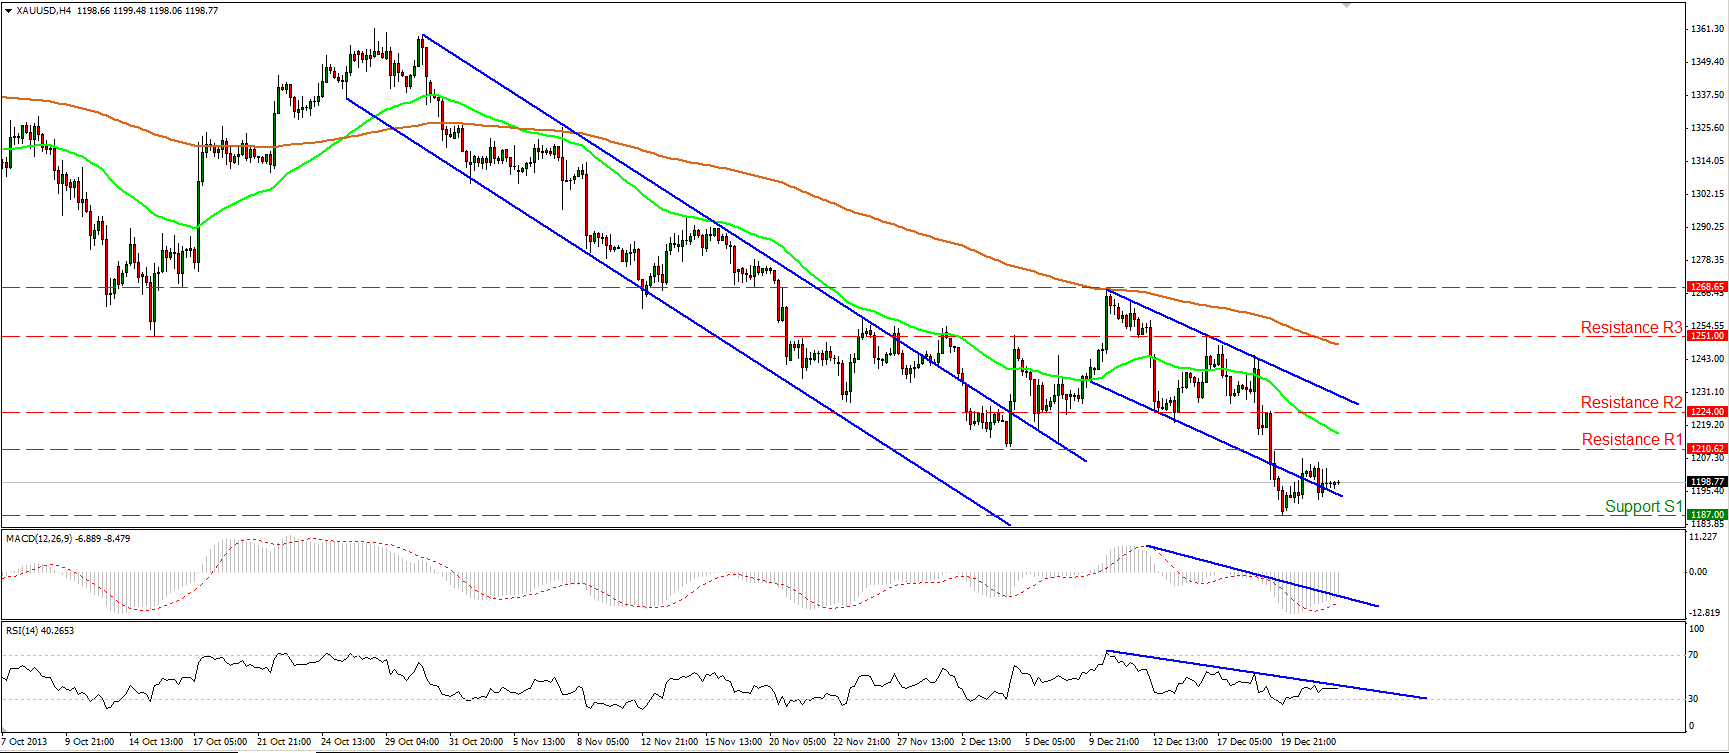
Gold also moved in a consolidative mode during a quiet trading Monday. Since the metal is forming lower highs and lower lows, I consider the bias to the downside. The 50-period moving average remains below the 200-period moving average, while both momentum studies follow downward paths, completing the negative picture of the price action.
• Support: 1187 (S1), 1180 (S2), 1155 (S3).
• Resistance: 1210 (R1), 1224 (R2), 1251 (R3).
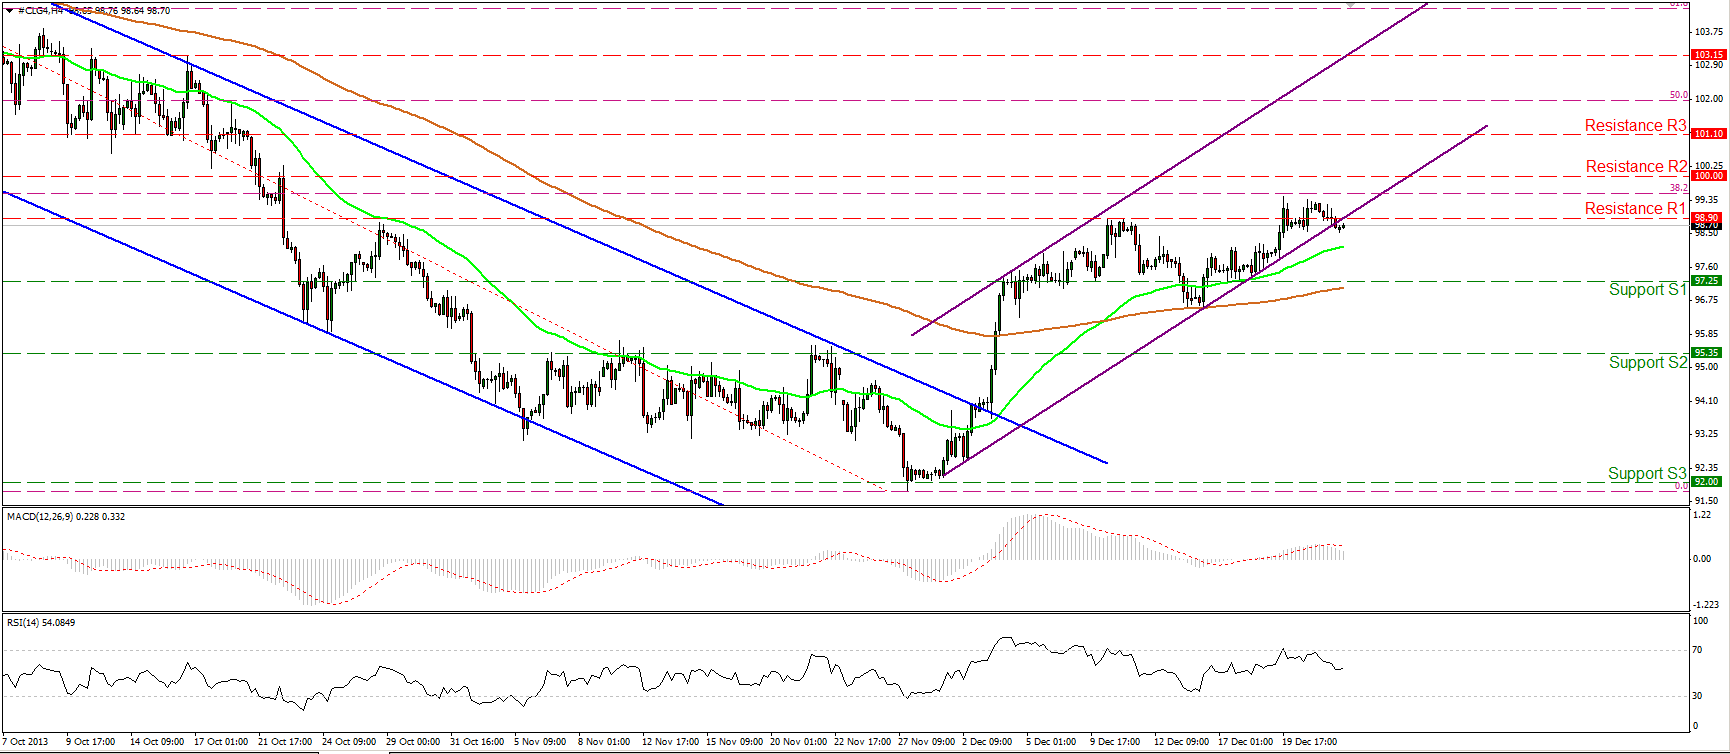
WTI moved slightly lower on Monday and is now back below the 98.90 level. The price also broke slightly below the lower boundary of the upward sloping channel. If the bears manage to maintain the price below those levels, we may see extensions towards the support barrier of 97.25 (S1). On the other hand we would w20asbwneed to see WTI overcoming the resistance area between the 38.2% Fibonacci retracement level of the prevailing downtrend and the round number of 100 (R2) in order to assume further advance. WTI is trading above both moving averages and a move back within the channel may signal that the current exit was just a fake break out.
• Support: 97.25 (S1), 95.35 (S2), 92.00 (S3).
• Resistance: 98.90 (R1), 100.00 (R2), 101.10 (R3).

