After opening lower against almost all currencies yesterday, the dollar bounced back during the day and is starting trading in Europe Tuesday slightly higher against most currencies than it was 24 hours ago. This comes despite a disappointing Empire State manufacturing survey for September, which came out at 6.2 vs expectations of 9.10. That gave the dollar a further kick downward but the US currency recovered some of its losses after the US industrial production for August came out in line with expectations at +0.4% mom. Apparently many investors are not so sure that Janet Yellen is going to get the Fed post by default; some people believe former Bank of Israel Gov. Stanley Fisher would be in the running for the Fed post as well. The 10-year Treasury yield had been down to 2.78% at one point but finished the day at 2.86%, while Fed Funds futures that had been up 11 bps at one point were 4 bps off their peaks by the close as the “no Summers” rally faded.
The dollar may be able to regain some of its losses further but with Fed policy in flux, there are perhaps better ways to play the monetary divergence theme. Long NZD/JPY, long AUD/JPY, short AUD/NZD, short EUR/GBP, EUR/NOK or EUR/SEK. These are some ways to play policy divergence without involving the dollar. The minutes from the Reserve Bank of Australia’s recent policy meeting, released overnight, only confirmed the policy divergence between Australia, which reserves the right to ease further, and New Zealand, which has shifted to a tightening bias. The RBA members said they should neither “close off the possibility” of further rate cuts nor signal any intention – which seems to me that they are retaining an easing bias. They also said that “some further decline in the exchange rate would be helpful.” On the other hand, NZ has definitely said that its next move on rates will be up. See my article on the CNBC guest blog “Trading the Fed taper: avoid the dollar”.
Typhoon Man-yi hit Japan yesterday and caused further disruption to the country’s nuclear power. It forced Tepco, the operator of the destroyed Fukushima nuclear power plant, to vent more radioactive water into the ocean, and also cut off all access to the experimental Monju fast breeder reactor on the other side of Japan after a mudslide closed the only road leading to the facility. Data transmission was also stopped, so no one knew what was going on in the reactor. Fortunately the worst seems to have been avoided this time but this nuclear issue is clearly not over and is one reason why I remain long-term bearish on the yen.
Today’s indicators include the September ZEW survey. Both the current situation index and the expectations indicator are expected to rise. That could prove EUR-positive, except that of course Germany is far from typical for the Eurozone. In the UK, the EU harmonized CPI and the Bank of England’s inflation target are expected slow slightly to 2.7% yoy from 2.8% yoy in July. That would be a victory for the Bank and perhaps GBP-positive as the pace of inflation slows for the second consecutive month towards their 2.5% target. In the US both headline and core CPI for August are expected at +0.2% mom, the same rise as in July and posing no problem for the Fed. Finally, the National Association of Homebuilders’ Index for September is forecast to fall slightly to 58 from 59. But, given the sharp rise recently, a drop of a point or two wouldn’t surprise or disappoint anyone.
The Market:
EUR/USD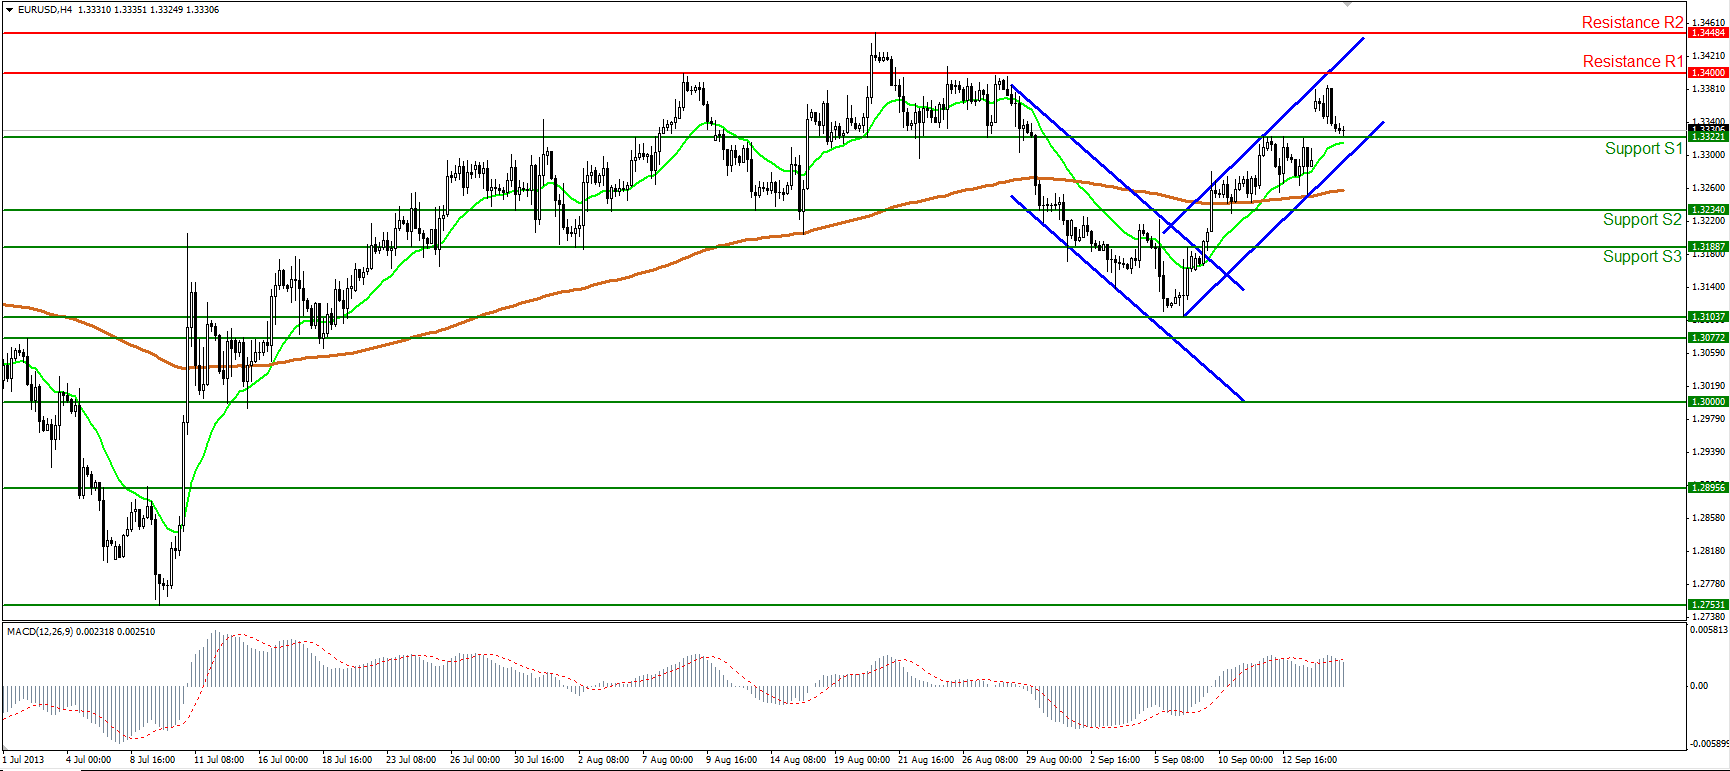
The EUR/USD moved lower during the day, covering yesterday’s opening gap. The pair remains in a near-term upward sloping channel and at the European opening was testing the 1.3322 (S1) support level. A clear break below that level, followed by an exit of the channel, might lead the rate towards the next support at 1.3234 (S2), while a rebound should challenge once more the well tested resistance of 1.3400 (R1). Although MACD lies in a positive territory, it crossed below its trigger, confirming the temporary weakness of the price action.
Support is found at the 1.3322 (S1) level, followed by 1.3234 (S2) and 1.3188 (S3)
Resistance levels are the critical level of 1.3400 (R1), followed by 1.3448 (R2) and 1.3517 (R3) (daily chart)
USD/JPY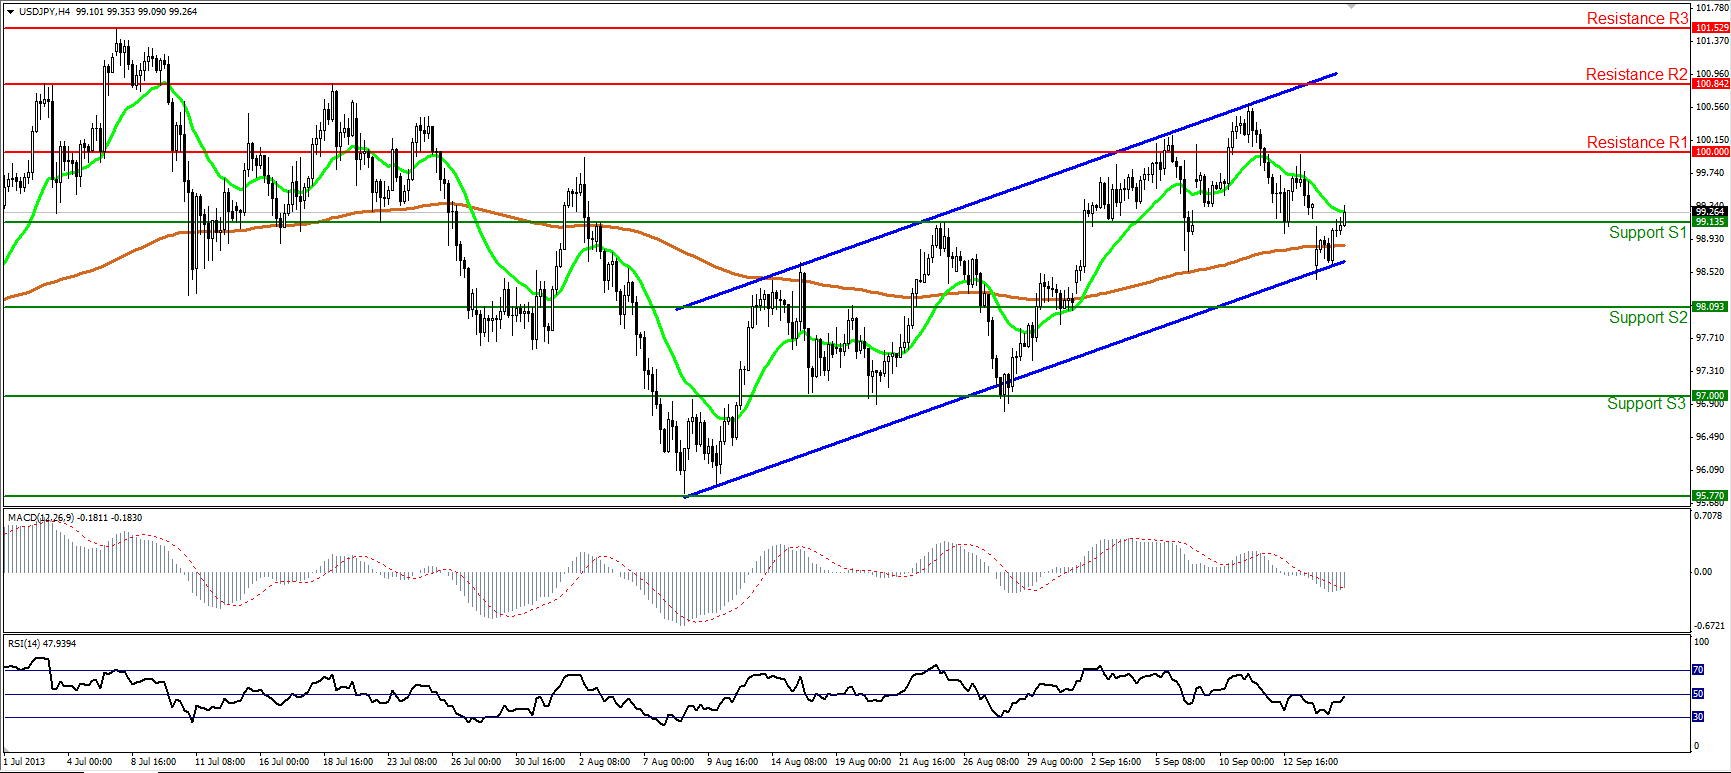
The USD/JPY moved higher after rebounding at the lower boundary of the uptrend channel and during the early European morning it managed to break the 99.13 barrier. I expect the bulls to continue driving the rate upwards, setting the first target at the psychological level of 100.00 (R1), where a clear break should trigger more extensions towards the resistance of 100.84 (R2) and the channel’s upper boundary. On the longer time frame (daily chart), the price returned and tested successfully the symmetrical triangle’s upper line, increasing the probabilities for further upward movement.
Support levels are at 99.13 (S1), followed by 98.09 (S2) and 97.00(S3).
Resistance is identified at the psychological level of 100.00 (R1), followed by 100.84 (R2) and 101.52 (R3).
GBP/USD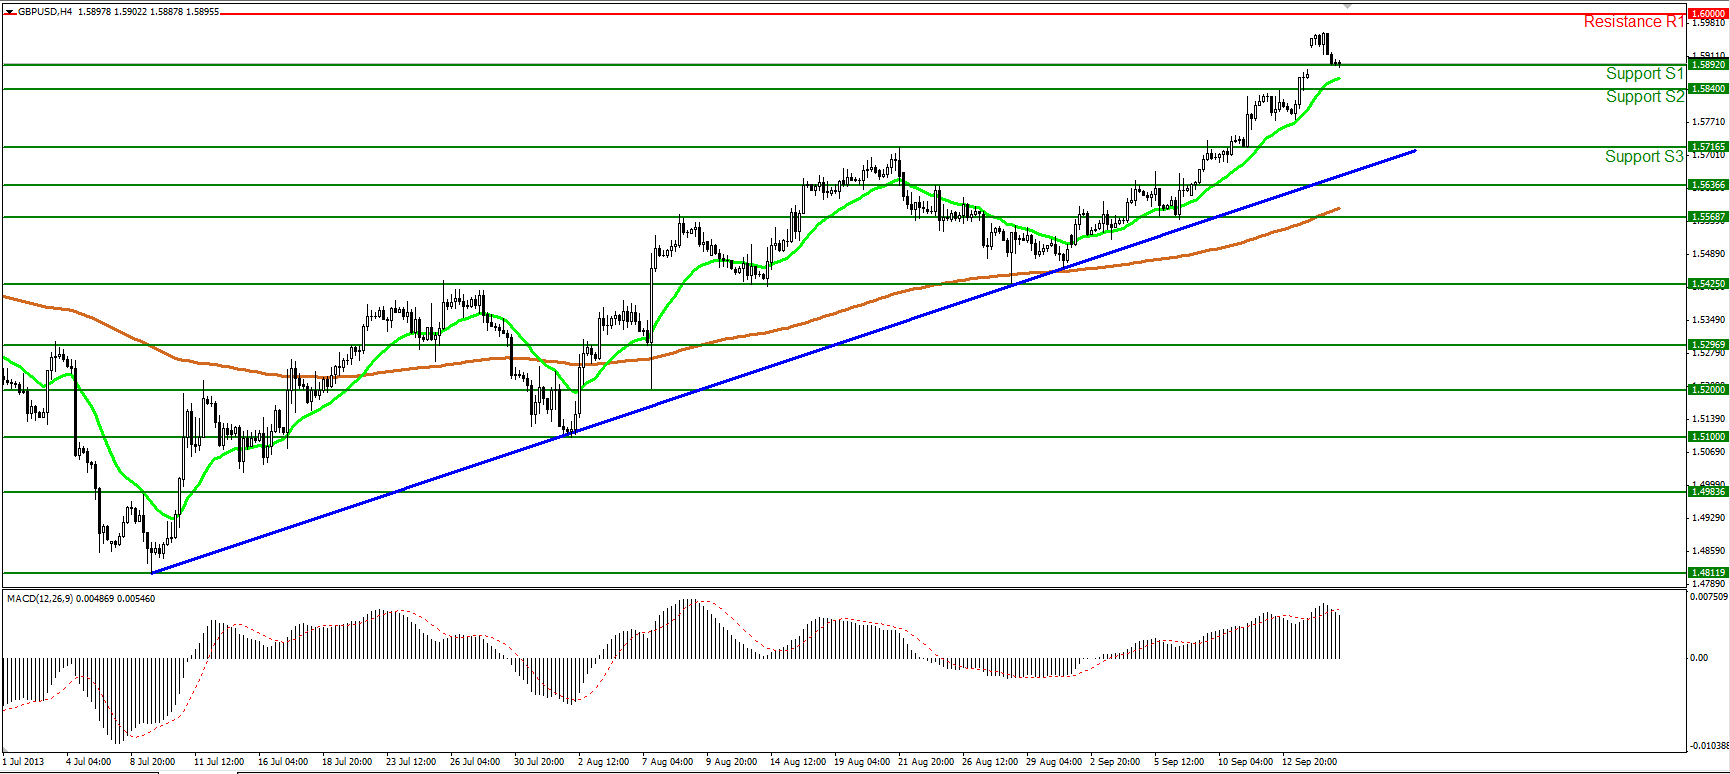
The GBP/USD moved lower trying to cover yesterday’s gap. At the time of writing the pair is testing the 1.5892 (S1) support level, where a downward break might be the first signal for a newborn correction towards the next support areas. The MACD oscillator supports the rate’s weakness, since it returned below its trigger line in its positive territory. However, the overall trend is still considered to be an uptrend, since the price is trading above the blue trend line and above both the 20-period and 200-period moving average
Support levels are identified at 1.5892 (S1), 1.5840 (S2) and 1.5716 (S3) respectively.
Resistance is found at the psychological level of 1.6000 (R1), 1.6080 (R2) and 1.6173 (R3), the latter two found from the daily chart.
Gold
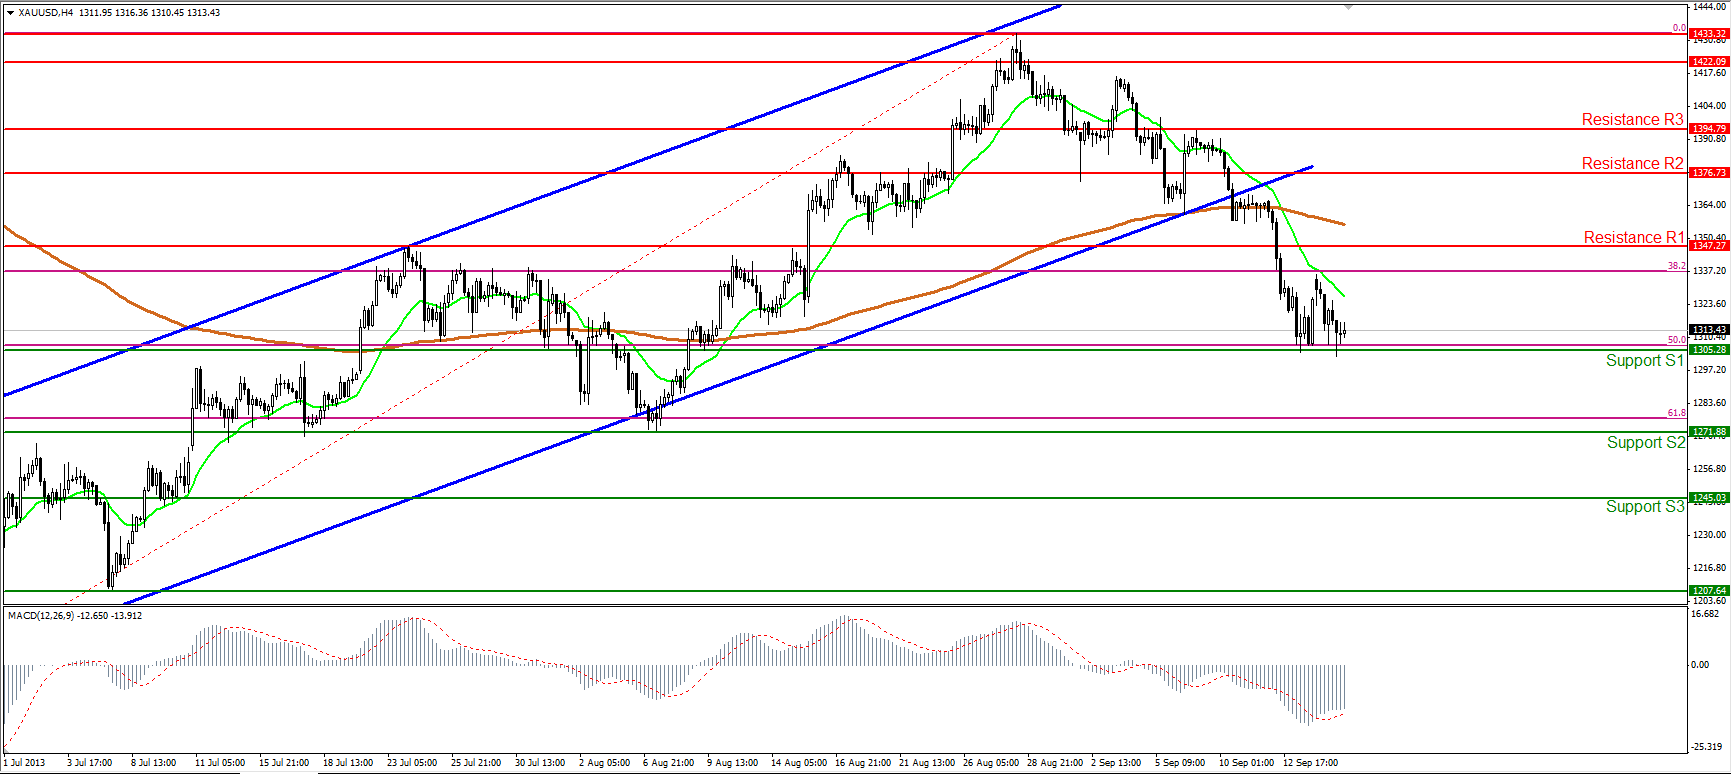
Gold fell once again, returning to and again testing the 1305 (S1) level, which coincides with the 50% retracement level of the 28th June - 28th August upward move. In early European trading the yellow metal lies slightly above that level and if the longs are strong enough to maintain the price above it, they should drive the battle towards the resistance barrier of 1347 (R1). The MACD oscillator reading is below zero but above its trigger, showing weakness for the price to continue its downward path.
Support levels are at 1305 (S1), followed by 1271(S2) and 1245 (S3).
Resistance is identified at the 1347 (R1) level, followed by 1376 (R2) and 1394 (R3).
Oil
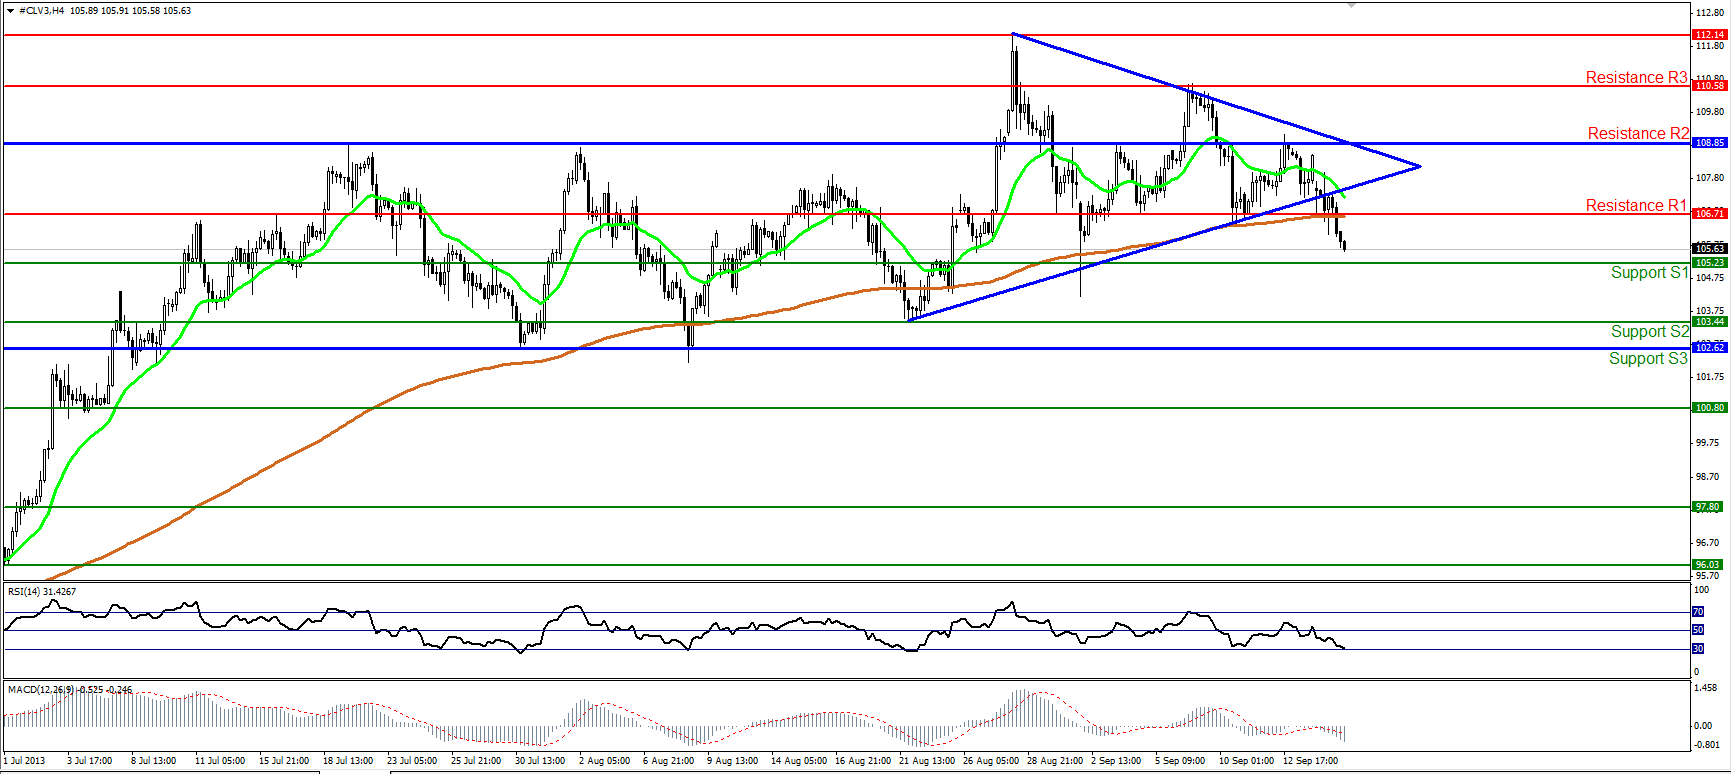
WTI moved lower, breaking below the 106.71 level and also below the lower boundary of a symmetrical triangle identified on our 4-hour chart. The bears are now driving the price towards the 105.23 (S1) support, where a clear downward penetration should lead them towards the next support of 103.44 (S2). RSI is slightly above the 30 level, pointing downwards, while the MACD lies below its trigger line in a negative zone, favoring a further downward move.
Support levels are at 105.23 (S1), 103.44 (S2) and 102.62 (S3).
Resistance levels are at 106.71 (R1), followed by 108.85 (R2) and 110.58 (R3).
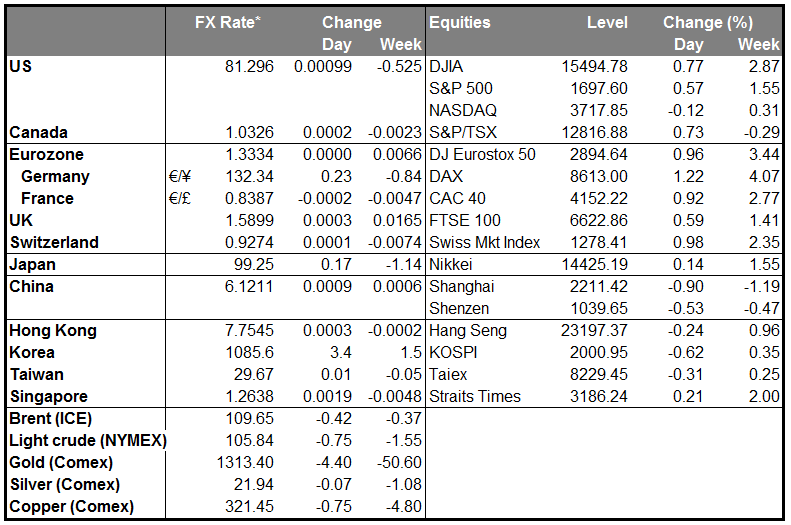
BENCHMARK CURRENCY RATES - DAILY GAINERS AND LOSERS
MARKETS SUMMARY

