First the action, then the reaction:
Following Thursday’s plunge in the dollar, Friday was a day of recovery after St. Louis Fed President James Bullard revived hopes of tapering. Many people in the market had thought that the FOMC must have had strong reasons not to begin tapering off bond purchases this month, as the group usually prefers to meet market expectations and does not like to cause confusion in the marketplace. However Bullard revealed that the decision was “borderline”, and that the FOMC meeting on Oct. 29th-30th will be a “live” FOMC meeting that could decide on a “small taper” if the data justifies such a move. The comments were significant in that Bullard is a centrist on monetary policy, unlike the hawkish Kansas City Fed President Esther George, who said she was “disappointed” by the decision. Thus it’s back to Square One again and we resume speculation over tapering. NOK, the big winner on Thursday, was the biggest loser on Friday and in the EM world, USD/ZAR even closed above its pre-FOMC levels. Volatility is likely to increase and each US economic indicator – particularly the weekly jobless claims and other labor market data – will be closely watched. A Bloomberg survey now indicates that a small majority of economists (24 out of 41) expect tapering to begin at the Dec. 17th-18th meeting (there is no meeting in November).
In Germany, Chancellor Merkel has won dramatic support from the voters, yet with her coalition partner FDP likely to drop out of parliament, her personal victory is not a victory for the coalition as a whole. On the contrary, the result would be a huge shift in Germany’s political structure. The FDP usually stands for some pro-growth supply-side reforms and opposes tax hikes and so its defeat will weaken the voice for liberal policies that would raise Germany’s long-term growth potential. With Germany sliding slowly backwards on reform while some other countries are shaping up (ironically, under pressure from Germany), the risk is that Germany’s economic advantage may erode a little faster than it would have with the FDP in the government. Nonetheless, a slowdown in structural reforms will only affect growth over the longer term, while short-term, with Merkel and her strengthened CDU/CSU in charge, Germany has demonstrated its overwhelming support for pro-Europe policies. Thus I expect the result to be slightly EUR-positive, although the likely result – a coalition with the SPD – is pretty much what the market had expected and thus no surprise. The market had been CDU was in coalition with SPD during her first term in office so there is not likely to be any major shift in policies. The Social Democrats favour less austerity in the peripheral countries, which could be beneficial for eurozone growth and hence take some pressure off the ECB to ease EUR-positive.
Today’s indicators include the preliminary manufacturing and service-sector PMIs for China, France, Germany, and the eurozone as a whole for September. China got the ball rolling overnight with a higher-than-expected 51.2, up from 50.1 in August. The manufacturing PMIs for Europe are all expected to improve and to be over 50, showing that the eurozone economy continues to expand, which could be EUR-positive. In the US, the Markit preliminary manufacturing PMI is coming out for September, but that isn’t as closely watched as the ISM index (due out 1 Oct) is. The market will be focusing today on speeches by several Fed officials: NY Fed President Dudley, Atlanta Fed President Lockhart and Dallas Fed President Fisher. The dovish Dudely (1 on the Reuters 1-5 scale) will probably be the most closely watched of these speeches, especially as the other two are not voters. Also, ECB President Mario Draghi speaks at European parliament in Brussels. The main items on the agenda for the week are the possible announcement of the next Fed Chairman and any news about a US budget agreement (or lack thereof), which could be seriously USD-negative.
The Market:
EUR/USDEUR/USD" title="EUR/USD" src="https://d1-invdn-com.akamaized.net/content/pic259022870c53f58b02b6810b47775157.png" height="744" width="1730" />
The EUR/USD continued moving sideways, remaining between the 1.3517 (S1) and 1.3564 (R1) levels. As Europe opens Monday the pair is testing the 1.3517 (S1) support, where a clear downside break should signal a short-term correction towards 1.3448 (S2) and the blue uptrend line. On the other hand, if the bulls manage to break above the barrier of 1.3564 (R1), I expect them to trigger extensions towards February’s highs at 1.3706 (R2). The former possibility seems more likely however as both oscillators show signs of weakness, since the RSI just exited its overbought area and the MACD crossed below its trigger line.
• Support is found at the 1.3517 (S1) level, followed by 1.3448 (S2) and 1.3400 (S3)
• Resistance levels are the level of 1.3564 (R1), followed by 1.3706 (R2) and 1.3846 (R3). The latter two are found from the daily chart.
EUR/JPYEUR/JPY" title="EUR/JPY" src="https://d1-invdn-com.akamaized.net/content/pic92d18eaaa83853c29783f8078d49552f.PNG" height="744" width="1730" />
The EUR/JPY moved lower during Friday’s session, after finding resistance at the 134.69 (R1) level and the upper boundary of the blue uptrend line. In my opinion the downward pullback might continue towards the 132.63 (S2) support, which coincides with the 38.2% Fibonacci retracement level of the previous impulsive wave. Weakness is also indicated by both oscillators, since the RSI exited its overbought area and the MACD poked its nose below its trigger line. However, I consider the overall trend of the pair to be an uptrend since the price is still trading into the blue uptrend channel and the 20-period moving average lies above the 200-period moving average.
• Support levels are at 133.34 (S1), followed by 132.63 (S2) and 131.70 (S3).
• Resistance is identified at 134.69 (R1), followed by 135.64 (R2) and 136.74 (R3). The latter two are found from the weekly chart.
GBP/USDGBP/USD" title="GBP/USD" src="https://d1-invdn-com.akamaized.net/content/picb65783119587780f762cc0702315e9f8.PNG" height="744" width="1730" />
The GBP/USD moved lower after finding resistance at the 1.6160 (R1) level. At the European opening the pair is testing the psychological support of 1.6000 (S1), where a clear downward break might signal the beginning of a short-term correcting phase. On the other hand, if the bulls manage to maintain the rate above that critical level, bullish extensions should be triggered towards new short term highs. The MACD oscillator favors the first scenario since it lies below its trigger line, providing weakness indications for the price action.
• Support levels are identified at the psychological level of 1.6000 (S1), 1.5892 (S2) and 1.5840 (S3) respectively.
• Resistance is found at the levels of 1.6160 (R1), followed by 1.6300 (R2) and 1.6380 (R3), both found from the daily chart.
Gold
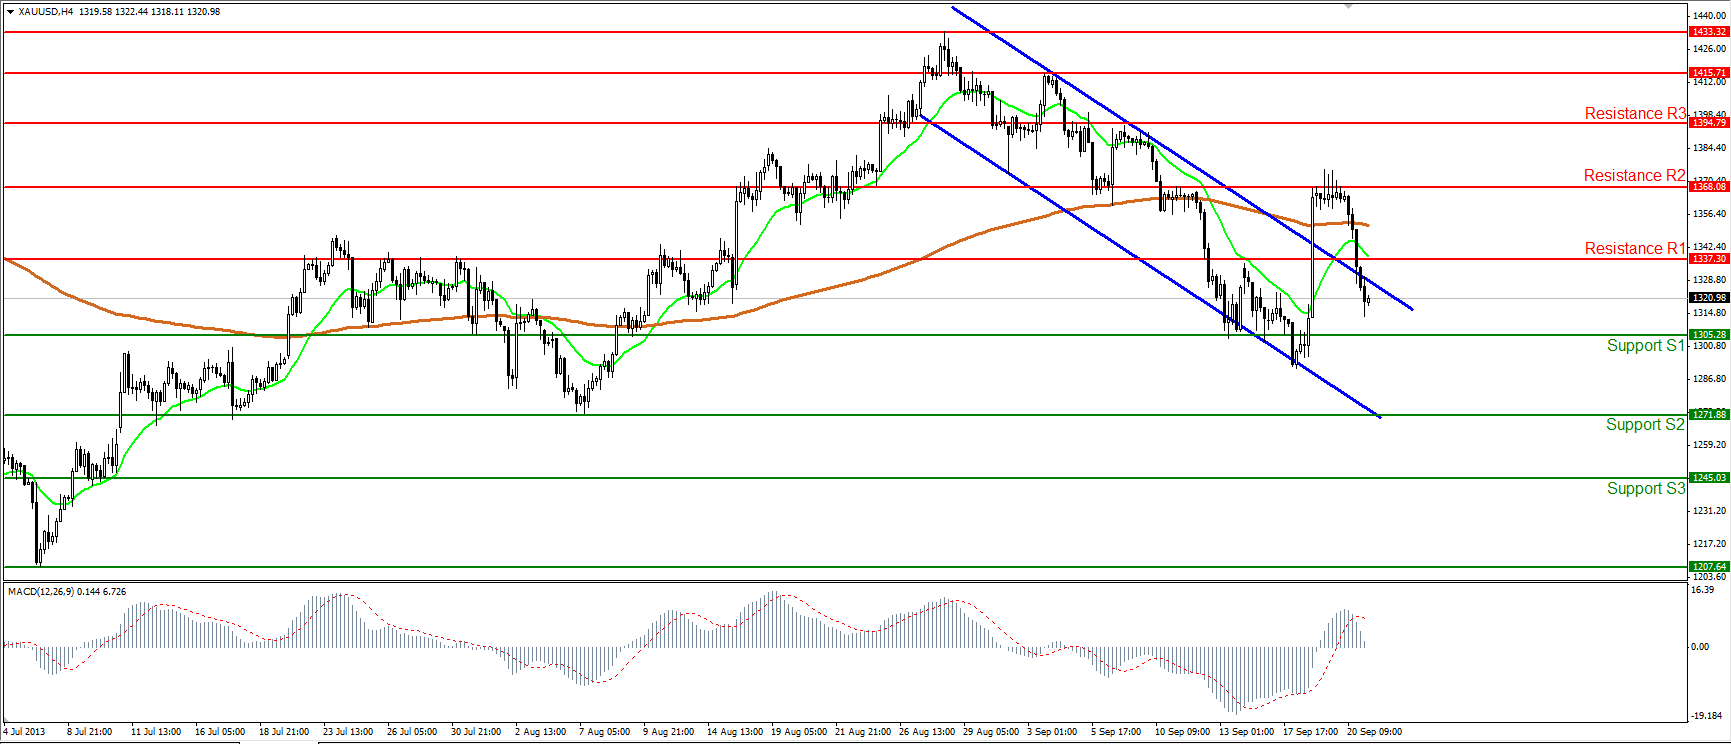
Gold plunged Friday after finding resistance at the 1368 (R2) level. The yellow metal managed to break below the 1337 level (Friday’s support) and returned back into its downward sloping channel. Currently the price is heading towards the barrier of 1305 (S1) and if the bears continue their momentum breaking below it, I expect them to challenge the next support at 1271 (S2). The MACD oscillator lies near its zero line, not confirming the negative momentum, but it crossed below its trigger line, favoring a potential entry in its bearish territory.
• Support levels are at 1305 (S1), followed by 1271 (S2) and 1245 (S3).
• Resistance is identified at the 1337 (R1) level, followed by 1368 (R2) and 1394 (R3).
Oil
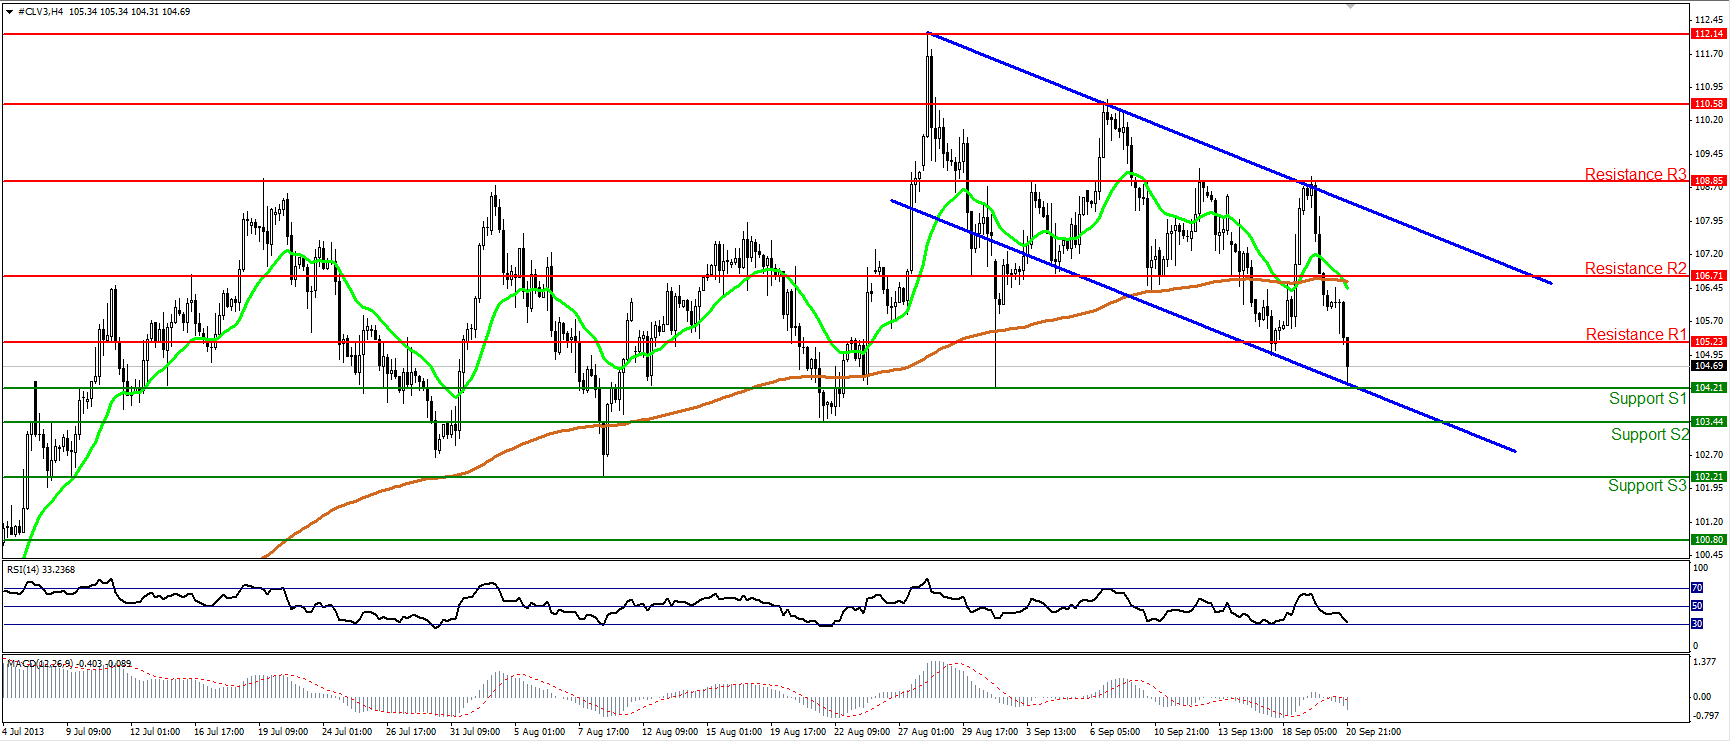
WTI continued falling, breaking below the 105.23 level (Friday’s support). The price is currently finding support at the 104.21 (S1) level, which coincides with the lower boundary of the downtrend channel. A clear break below that strong hurdle should target the next support levels of 103.44 (S2) and 102.21 (S3) respectively. The 20-period moving average just crossed below the 200-period moving average and alongside with MACD’s bearish indications, it confirms the negative picture for WTI.
• Support levels are at 104.21 (S1), 103.44 (S2) and 102.21 (S3).
• Resistance levels are at 105.23 (R1), followed by 106.71 (R2) and 108.85 (R3).
BENCHMARK CURRENCY RATES - DAILY GAINERS AND LOSERS
MARKETS SUMMARY:


