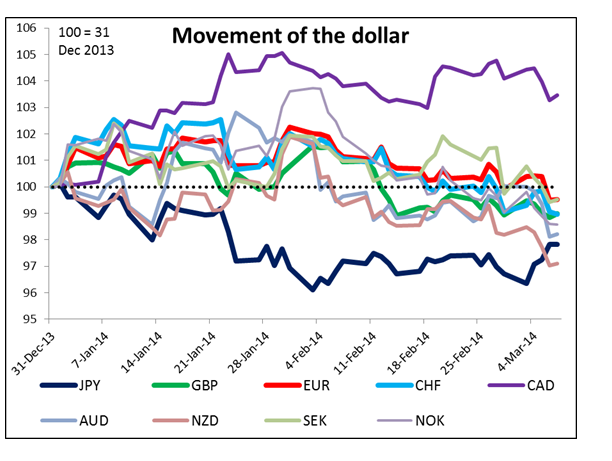
Once again the ECB disappointed market expectations and failed to make any changes in its monetary policy. It didn’t even stop the sterilization of its EUR 177bn holdings within its Securities Market Program (SMP), as had been broadly hinted before the meeting. ECB President Draghi’s comments were largely the same as in the previous several meetings. The market has learned that comments like “we will consider all policy options” and that “all options remain on the table” really mean that they have not decided to use any of those options yet. Moreover it turns out that the ECB’s forecast for inflation at end-2016 is conveniently 1.7%, which is just near enough to their target of “close to but below 2%” that the ECB is not compelled to make any changes in policy. As a result, the EUR hit a new high for 2014 against the dollar (as did AUD, NZD and SEK; GBP hit a new closing high). This was despite a lower-than-expected jobless claims number and rising interest rates in the US (although factory orders did fall more than expected). In EM, the market continues to believe that the Ukrainian crisis is over; EM stocks rose and the dollar lost ground against almost all the EM currencies we track (the exceptions being BRL and RUB).
Today will be another day of waiting, this time for the US non-farm payroll figures for February. The market consensus forecast has fallen to 149k after the last two disappointing figures, but probably the real consensus is lower – the average forecast includes ones that were made a couple of weeks ago, while the median of forecasts made in the last two days is 136k. Forecasts on Twitter are even lower; the median there is 122k. So it’s hard to say what will be a surprising figure. A third negative surprise in a row for the NFP could convince people that the cold weather was only an excuse and reveal that the US labor market is really facing problems. That could be negative for the dollar, because people would start to wonder if the Fed will continue tapering off its bond purchases, and interest rates would probably fall as a result. EUR/USD has moved higher over the following week after four of the last six times that the NFP missed estimates (it was unchanged once and lower once). I’m not sure it makes much difference though, because the results when the figure beat estimates were largely the same. When the figure beats estimates, the pair with the biggest increase in volatility is USD/JPY, followed by USD/NOK and USD/DKK, then GBP/USD and finally EUR/USD. On negative surprises the increase in volatility is much less. The biggest increase is again in USD/JPY, followed by USD/CAD and USD/CHF. Other G10 pairs see no major increase in volatility.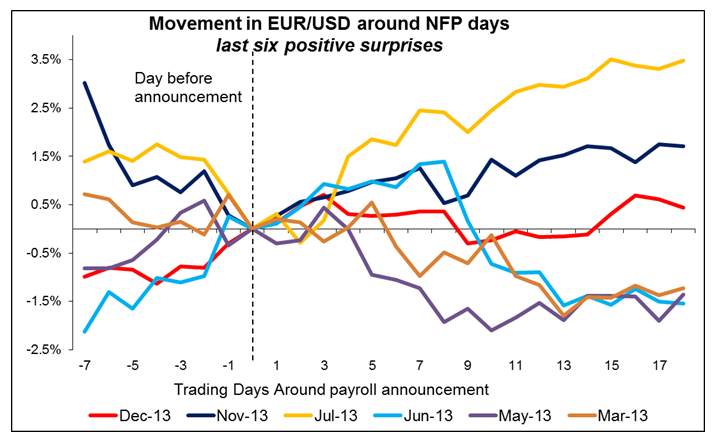
The US unemployment rate for February is forecast to have remained unchanged at 6.6%. At the same time, we get the US trade data for January, but I expect the figure to pass unnoticed.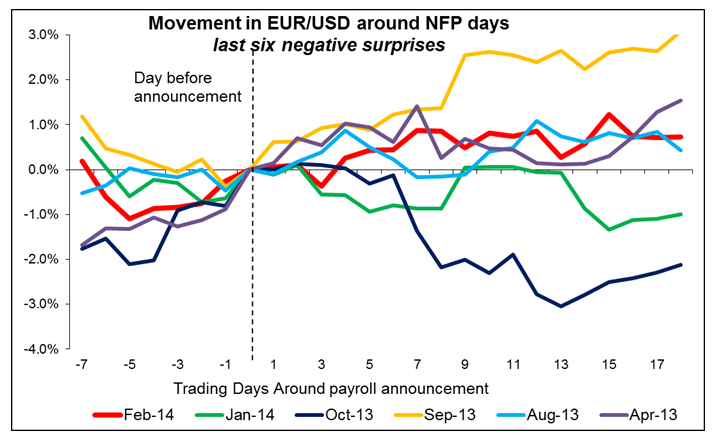
In Germany, industrial production for January is expected to have risen 0.8% mom, a turnaround from a 0.6% mom fall in December. Switzerland’s unemployment rate for February is forecast to have remained at 3.2% on a seasonally adjusted basis, while the country’s CPI for the same month is expected to touch zero on a yoy basis vs +0.1% yoy in January. Finally, Canada’s unemployment rate for February is expected to remain at 7.0%.
Two speakers are scheduled on Friday. Former Federal Reserve Chairman Ben Bernanke will address a conference on energy industry, while the New York Fed President William C. Dudley will speak on the economy at Brooklyn College.
The Market
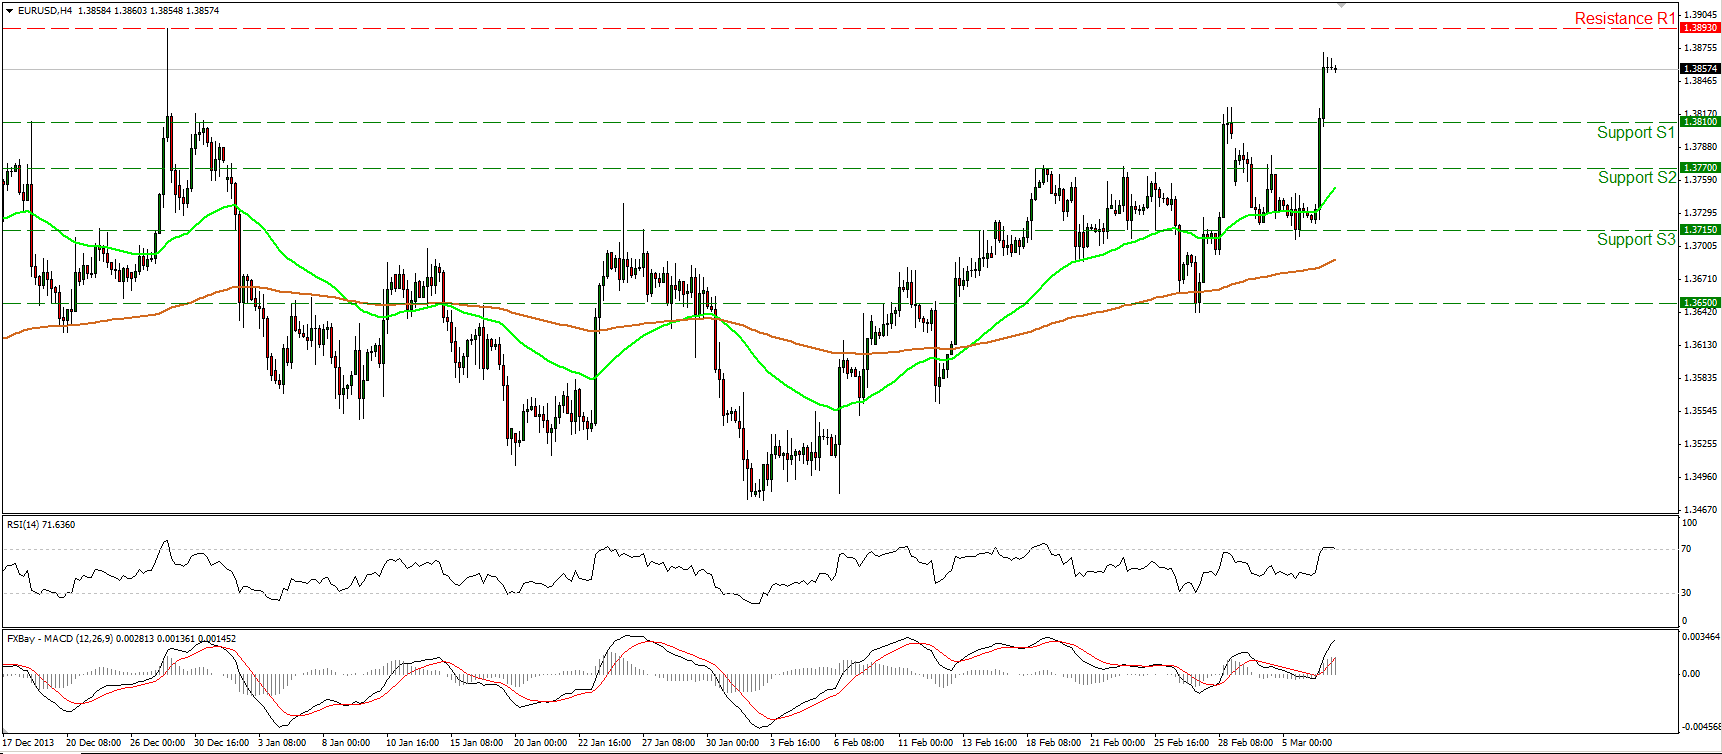
The EUR/USD rallied yesterday after ECB President Mario Draghi introduced the Eurozone GDP and inflation projections for 2016. The pair violated two resistance levels in a row and is now trading below December’s highs at 1.3893 (R1). The RSI seems ready to exit its overbought territory thus I would expect a corrective wave before the bulls prevail again. The structure of higher highs and higher lows remains in progress thus I see a positive short-term picture. In the bigger picture, a clear close above the 1.3893 (R1) would signal the continuation of the longer-term uptrend and have larger bullish implications.
• Support: 1.3810 (S1), 1.3770 (S2), 1.3715 (S3).
• Resistance: 1.3893 (R1), 1.4000 (R2), 1.4200 (R3).
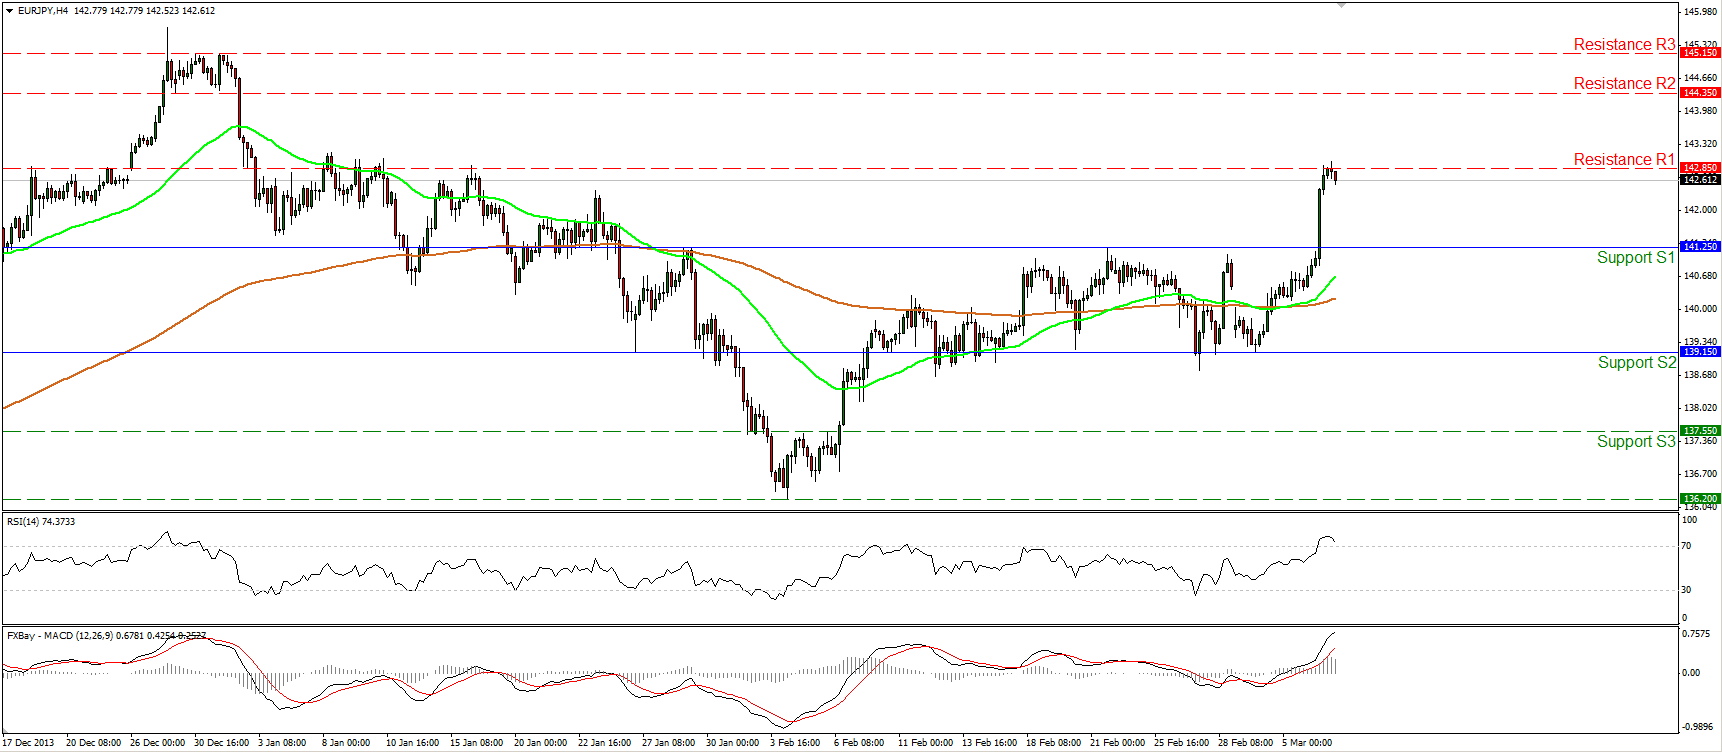
The EUR/JPY also rallied on Draghi’s comments, breaking above the upper boundary of the sideways path it was trading recently. Nonetheless the jump was stopped at the resistance of 142.85 (R1).The short-term outlook has now turned positive and a clear break above the 142.85 (R1) may target the next one at 144.35 (R2). However, since the RSI lies above 70, pointing down, I would expect a downward corrective wave before the development of further advance.
• Support: 141.25 (S1), 139.15 (S2), 137.55 (S3)
• Resistance: 142.85 (R1), 144.35 (R2), 145.15 (R3).
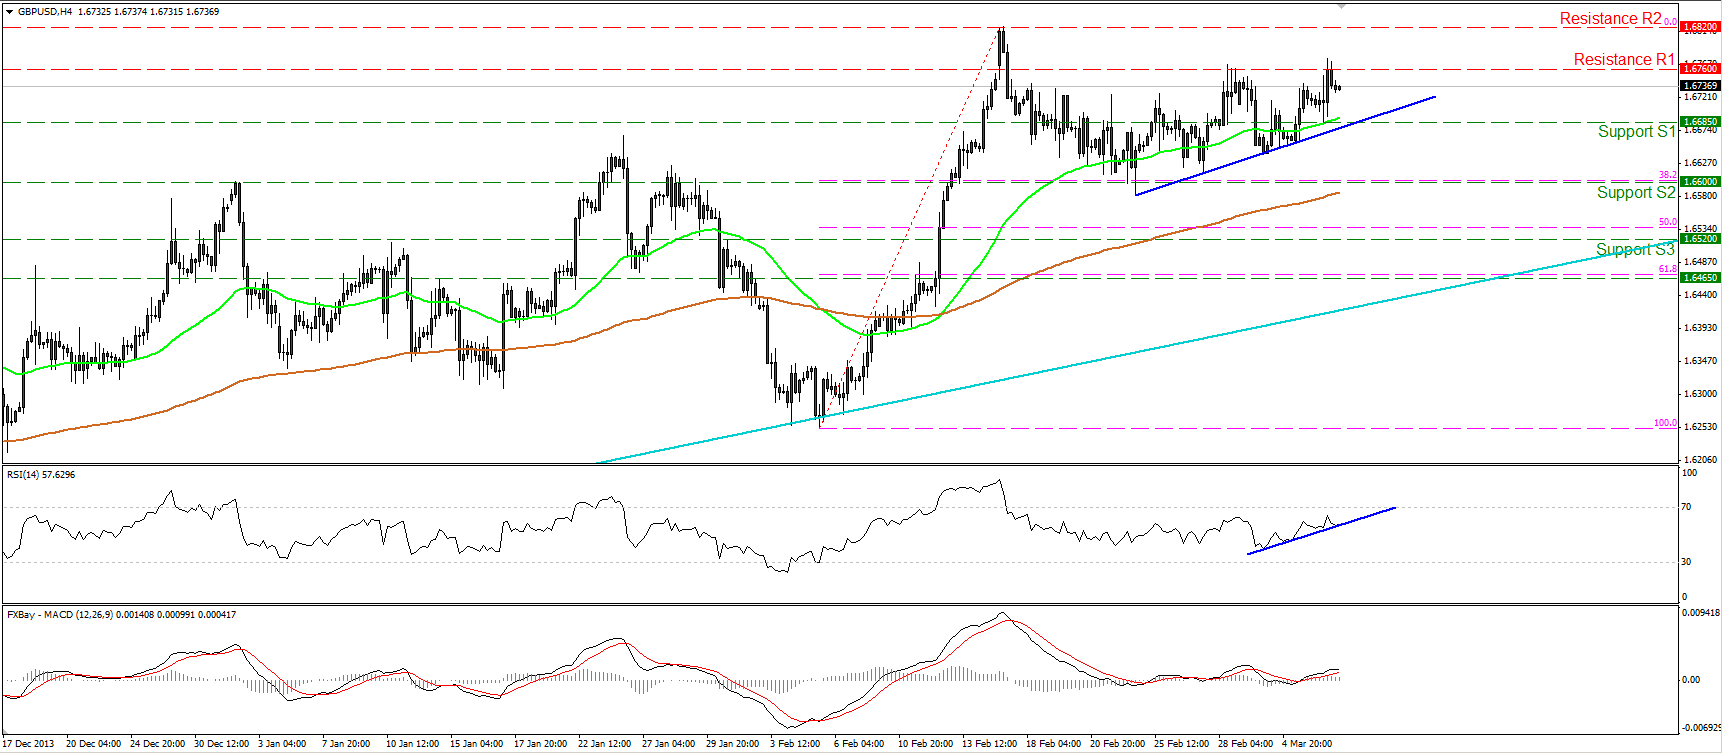
The GBP/USD moved slightly higher on Thursday and is now trading just below the 1.6760 (R1) resistance hurdle. I expect the pair to continue moving higher and challenge the recent highs at 1.6820 (R2). The RSI follows an upward path, while the MACD lies above both its signal and zero lines, increasing the possibilities for further advance. On the daily chart, as long as the rate is trading above the long-term uptrend (light blue line), I consider the major upward path to remain intact.
• Support: 1.6685 (S1), 1.6600 (S2), 1.6520 (S3).
• Resistance: 1.6760 (R1), 1.6820(R2), 1.6885 (R3).
Gold
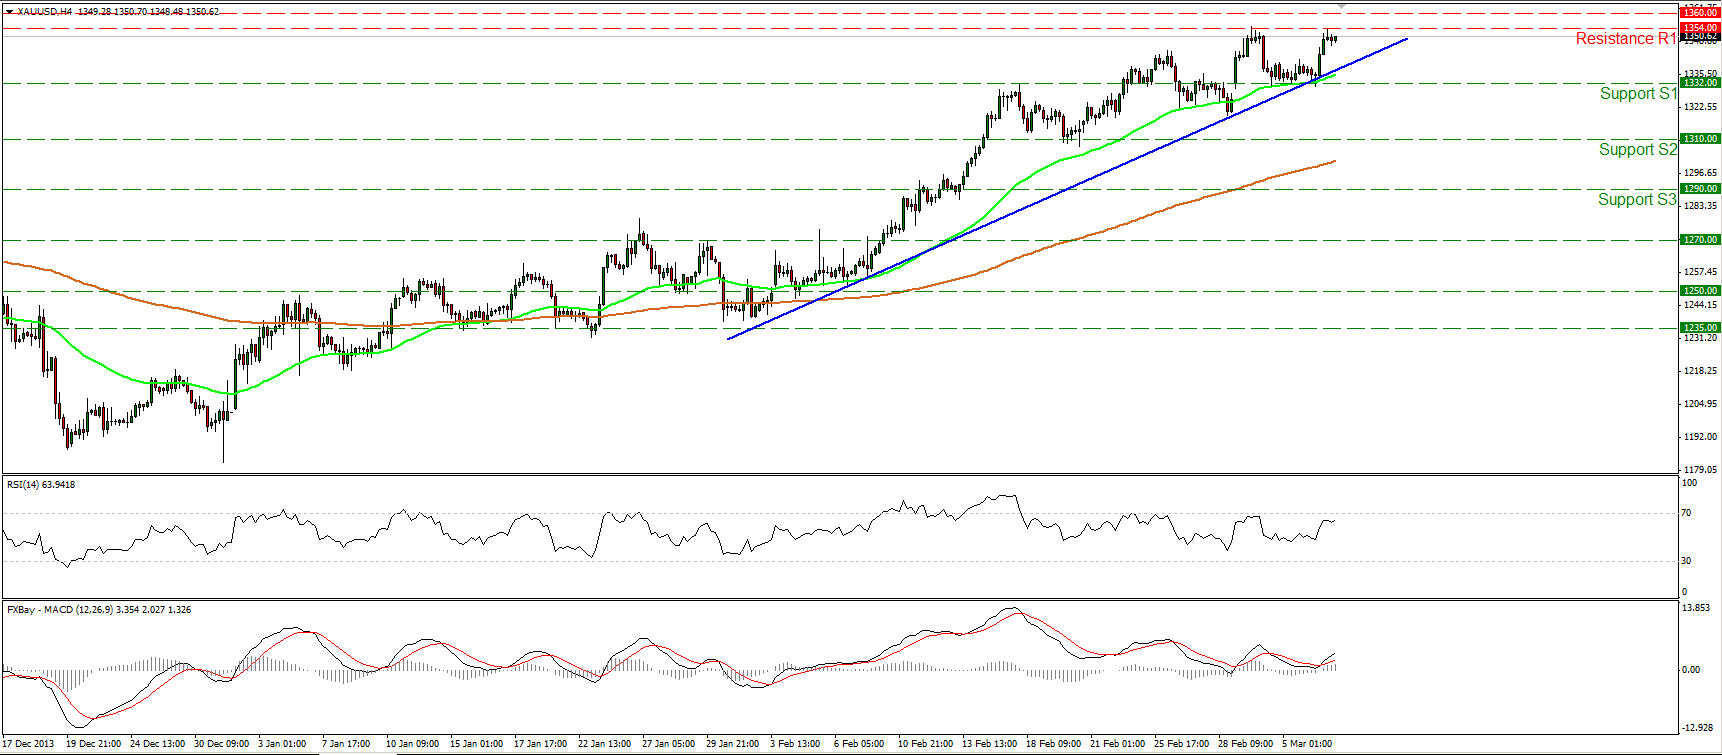
Gold rebounded from the support of 1332 (S1), near the blue uptrend line and the 50-period moving average, and reached once again the recent highs at 1354 (R1). I still expect the price to challenge the 1360 (R2) resistance, where a clear violation may trigger further extensions towards the next hurdle at 1370 (R3). The MACD, already in its bullish territory, crossed above its trigger line, indicating that the metal gained momentum. As long as the price is trading above both the moving averages and above the blue uptrend line, the short-term outlook remains positive.
• Support: 1332 (S1), 1310 (S2), 1290 (S3).
• Resistance: 1354 (R1), 1360 (R2), 1370 (R3)
Oil
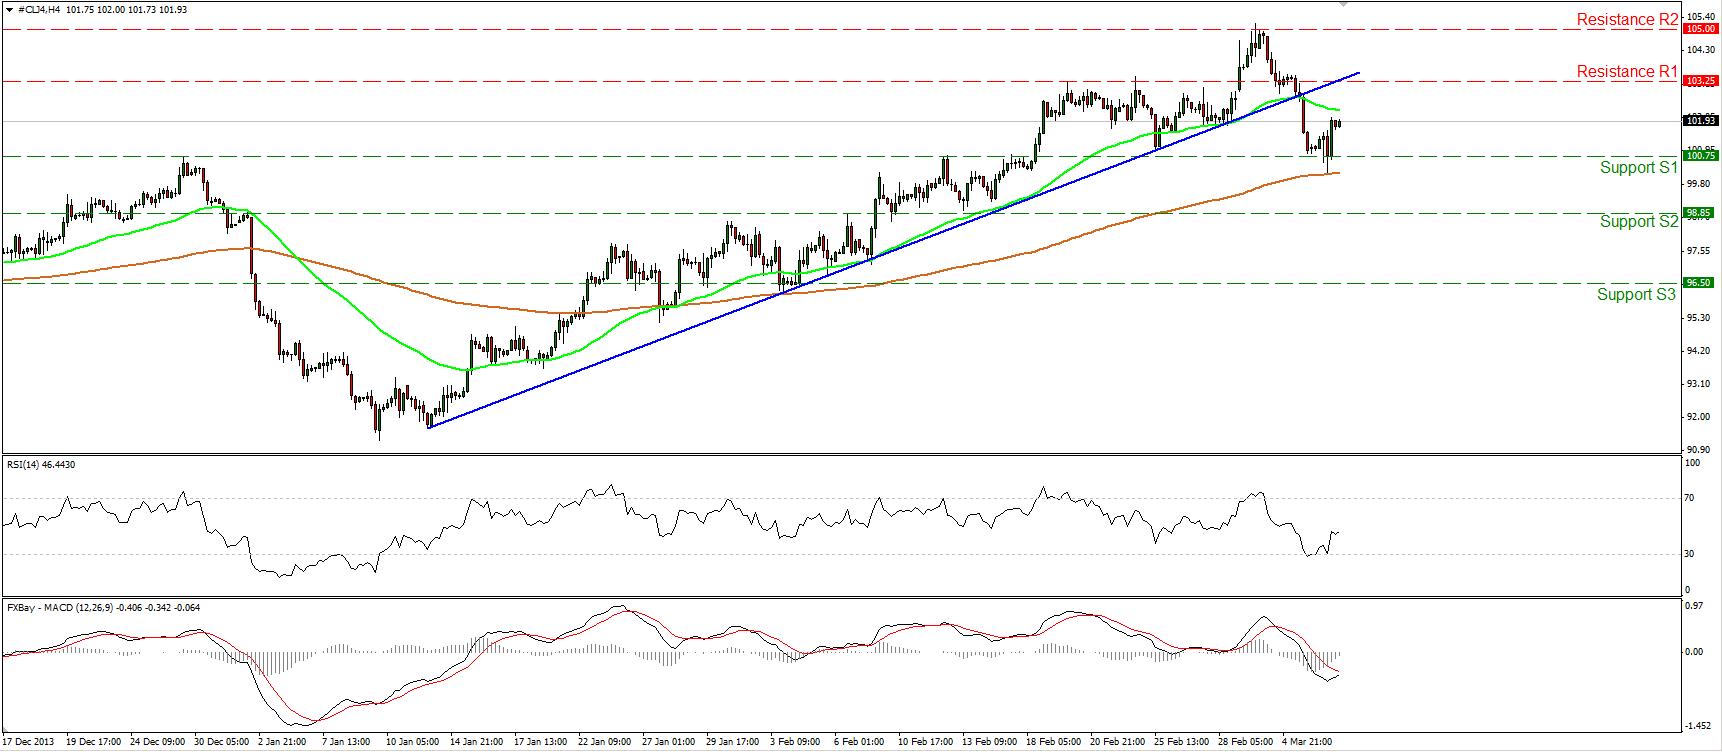
WTI found support at the 100.75 (S1) barrier and moved slightly higher. As mentioned in previous comments, a break below that bar is needed to confirm a lower low and flip the near term outlook to the downside. The price is trading below the 50-period moving average, but remains supported by the 200-period one, thus a downward violation of the latter moving average may be an additional negative sign and increase the possibilities for further declines.
• Support: 100.75 (S1), 98.85 (S2), 96.50 (S3)
• Resistance: 101.25 (R1), 105.00 (R2), 108.15 (R3).
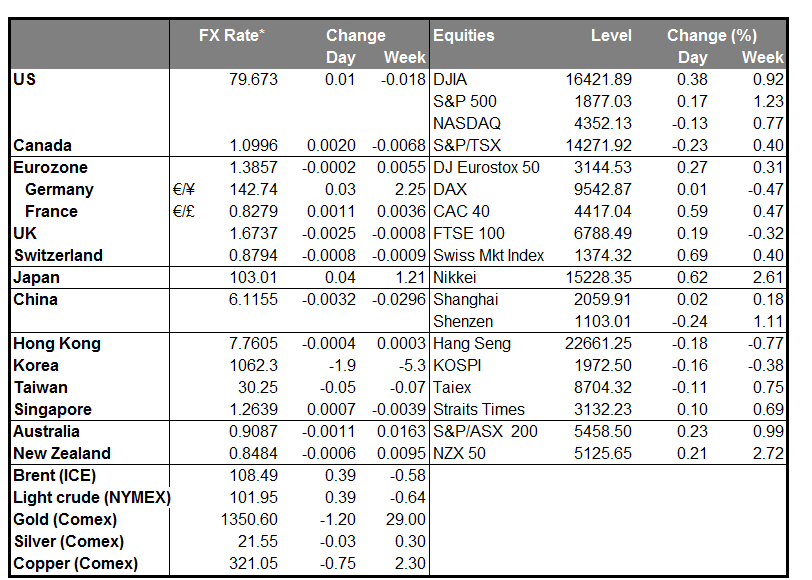
BENCHMARK CURRENCY RATES - DAILY GAINERS AND LOSERS
MARKETS SUMMARY
Disclaimer: This information is not considered as investment advice or investment recommendation but instead a marketing communication. This material has not been prepared in accordance with legal requirements designed to promote the independence of investment research, and that it is not subject to any prohibition on dealing ahead of the dissemination of investment research. IronFX may act as principal (i.e. the counterparty) when executing clients’ orders. This material is just the personal opinion of the author(s) and client’s investment objective and risks tolerance have not been considered. IronFX is not responsible for any loss arising from any information herein contained.
Past performance does not guarantee or predict any future performance. Redistribution of this material is strictly prohibited. Risk Warning: Forex and CFDs are leveraged products and involves a high level of risk. It is possible to lose all your capital. These products may not be suitable for everyone and you should ensure that you understand the risks involved. Seek independent advice if necessary. IronFx Financial Services Limited is authorised and regulated by CySEC (Licence no. 125/10). IronFX UK Limited is authorised and regulated by FCA (Registration no. 585561). IronFX (Australia) Pty Ltd is authorized and regulated by ASIC (AFSL no. 417482)

