The dollar had a generally strong day. It was unchanged to higher against most G10 currencies, and almost all the EM currencies that we track. The NZD and NOK were the only G10 currencies to show any significant gains vs the USD. The strength in the NZD was notable in that the AUD on the other hand was one of the loser. The RBA meets next Tuesday and they have a dovish tone, in contrast to the distinctly hawkish RBNZ. The short AUD/NZD seems like one of the purest monetary policy divergence trades available nowadays.
The strength of the dollar seems odd considering that the US government seems to be on track for disaster. The one-year CDS on US government debt has approximately tripled in the last week to 31 from 11.4 (although this is down from 57.5 on Monday!). On an absolute scale this is still not very high (for Italy it’s 115, for example), nonetheless it shows increasing fears about the game of chicken that the Republican Party is playing. Plus, yesterday’s economic data was mixed; while jobless claims fell, pending home sales slowed for the third consecutive month.
While politics in the US are worrisome, there are problems in the Eurozone as well. Italian bond yields jumped 10 bps yesterday after former PM Berlusconi’s allies in the Senate threatened that, “if Berlusconi is expelled, we all declare ourselves expelled,” as one said. The coalition government in Italy depends on Berlusconi’s allies and could therefore collapse. The EUR/USD may be trapped in a range due to the political problems on both sides, but that shouldn’t prevent other pairs from benefiting. The CHF seems likely to strengthen further on safe-haven inflows in response to the problems, but we would point out that EUR/CHF at 1.2268 has limited downside – the SNB has reaffirmed its commitment to the 1.20 floor. At least we know where the bottom is likely to be. Selling the USD/CHF would probably be the way to play this while looking for the opportunity to switch out and go long EUR/CHF.
The European morning starts with news from UK with a rise expected in the Nationwide house price index for September. That could bolster the GBP. Later in the day, the German EU harmonized CPI preliminary number for September is expected to remain at +1.6% yoy, which would not have any market impact. Norwegian September unemployment is expected to fall; on Wednesday, NOK fell sharply when the Labor Force Survey unemployment rate for July came out higher than expected, so today’s fall could help to strengthen the NOK further (although this series is not seasonally adjusted, unlike Wednesday’s). In the US, growth in personal income and spending are expected to have accelerated in August and the final U of Michigan consumer confidence index for September is forecast to be revised up. These two indicators could be a USD-supportive. There are three Fed and two ECB speakers today. ECB President Mario Draghi and Bank of Italy Governor and ECB Council VP Visco speak in Milan during the European morning. Draghi has recently been dovish and while he may not say anything new, EUR/USD is likely to move lower if he repeats the same comments. Later in the day, the voluble New York Fed President William Dudley speaks for the third time this week. Chicago Fed President Charles Evans speaks on current economic conditions and monetary policy at a Norges Bank conference, and Boston Fed President Eric Rosengren speaks in New York analyzing the stability of funding.
The Market:
EUR/USDEUR/USD" title="EUR/USD" src="https://d1-invdn-com.akamaized.net/content/pice46c2ceb91432316fda49976f64223b0.png" height="810" width="1730">
The EUR/USD moved lower after finding resistance at the 1.3536 (R1) level and achieved a break below the blue uptrend line. At the European opening the pair is heading towards the 1.3461 (S1) support, where a clear downward break should trigger extensions towards the well-tested support of 1.3400 (S2). The recent weakness is also confirmed by the MACD, which moved lower and crossed below its trigger line. However, since the 20-period moving average holds above the 200-period moving average, I would consider any downward movement as a short-term correction
• Support is found at 1.3461 (S1), followed by 1.3400 (S2) and 1.3321 (S3).
• Resistance levels are the level of 1.3536 (R1), followed by 1.3564 (R2) and 1.3706 (R3) (daily chart).
EUR/JPYEUR/JPY" title="EUR/JPY" src="https://d1-invdn-com.akamaized.net/content/pic3776f72f6a75899d08246f9ba565279e.png" height="810" width="1730">
The EUR/JPY moved sideways yesterday, remaining between the 132.70 (S1) and 134.00 (R1) levels. At the beginning of the European morning the rate is tending to move slightly lower towards the former level. If the bears are strong enough to overcome that hurdle, I expect them to target the lower boundary of the uptrend channel and the support at 131.92 (S2). However, the overall trend of the pair remains an uptrend since the price follows the channel’s path and a bullish cross of the moving averages is still in effect.
• Support levels are at 132.70 (S1), followed by 131.92 (S2) and 130.96 (S3).
• Resistance is identified at 134.00 (R1), followed by 134.66 (R2) and 135.63 (R3). The latter one is found from the weekly chart.
GBP/USDGBP/USD" title="GBP/USD" src="https://d1-invdn-com.akamaized.net/content/pic662619538428ae18c55274a3020bddc5.png" height="810" width="1730">
The GBP/USD also moved sideways, remaining slightly above the psychological level of 1.6000 (S1). It seems that we have a big battle near that level and we should wait for the winner in order for the picture to get clearer. If the bears win, I expect them to trigger the correcting phase mentioned in previous comments. On the other hand, a victory by the bulls should drive the rate towards the highs we last saw at the beginning of January.
• Support levels are identified at 1.6000 (S1), 1.5890 (S2) and 1.5840 (S3)
• Resistance is found at 1.6160 (R1), followed by 1.6276 (R2) and 1.6376 (R3) respectively. The latter two are found from the daily chart.
Gold
Gold moved slightly lower after finding resistance at the 1335 (R1) level. The yellow metal remains between the support of 1316 (S1) and the aforementioned resistance. I consider gold’s bias neutral, since buying pressure does not seem strong enough to extend the move towards the previous peak’s level. This is also confirmed by the RSI and MACD which both lie at their neutral levels.
• Support levels are at 1316 (S1), followed by 1291 (S2) and 1273 (S3).
• Resistance is identified at the 1335 (R1) level, followed by 1368 (R2) and 1394 (R3).
Oil
WTI rebounded once more at the strong floor of 102.23 (S1) and remained between the aforementioned support and the resistance level of 103.53 (R1). The selling pressure does not seem enough to drive WTI below the 102.23 (S1) support, and an upside pullback into the channel should not surprise us. Nonetheless, the short term trend remains a downtrend, marked by the downward sloping channel and confirmed by the bearish crossover of the moving averages.
• Support levels are at 102.23 (S1), 100.65 (S2) and 99.12 (S3). The latter two are identified on the daily chart.
• Resistance levels are at 103.53 (R1), followed by 104.40 (R2) and 106.06 (R3).
BENCHMARK CURRENCY RATES - DAILY GAINERS AND LOSERS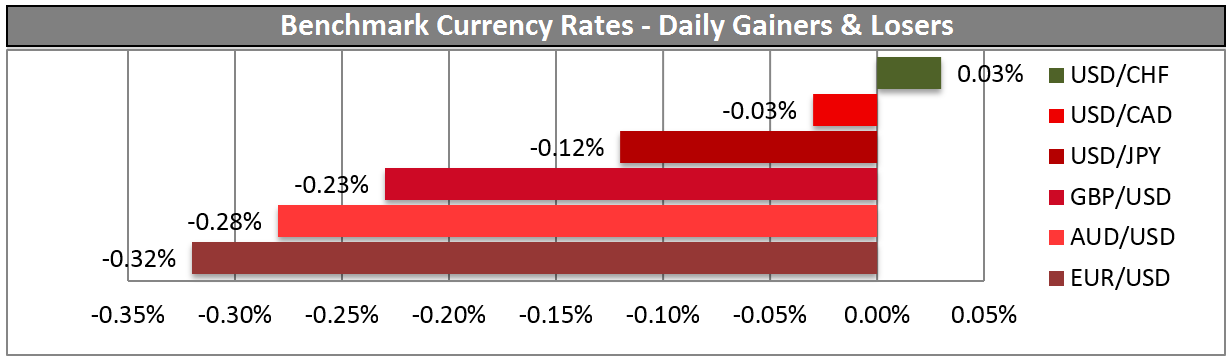
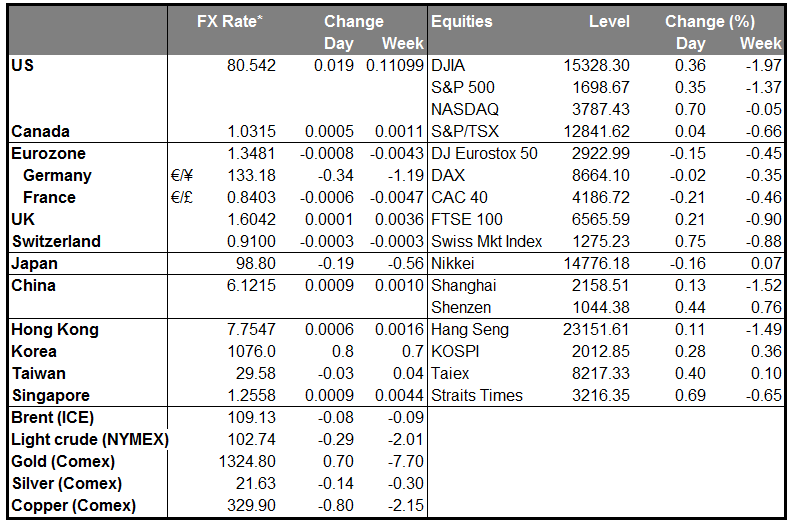
MARKETS SUMMARY