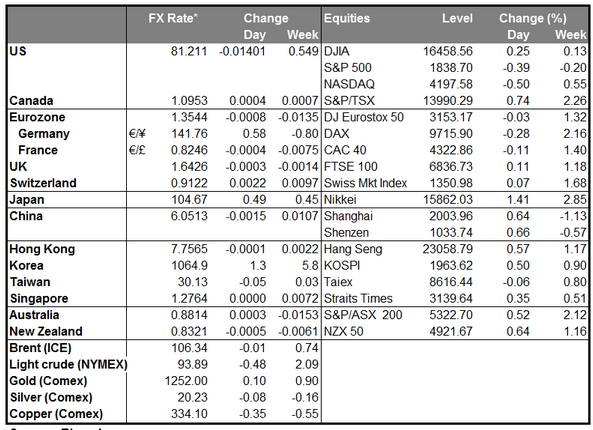
The stories this morning were in individual currencies rather than the dollar. On the one hand, the dollar is a lot stronger against the yen, as would be expected normally with the Tokyo stock market higher. The TOPIX index of Japanese stocks was up 0.6% today on recommendations that the government cut the corporate tax rates. There’s been a 42% correlation between the TOPIX and USD/JPY on a daily basis over the last year. There’s also a relatively strong positive correlation between USD/JPY and US Treasury yields, and 10-year US Treasury yields were 2 bps higher after several days of decline. The Bank of Japan started its two-day meeting and although no change in policy is likely this time, I expect them to expand their stimulus program sometime in Q2 after the hike in the consumption tax. That should provide another leg up for USD/JPY, in my view. The dollar was also higher vs SEK and NOK, which was probably carry-over from yesterday’s European action.
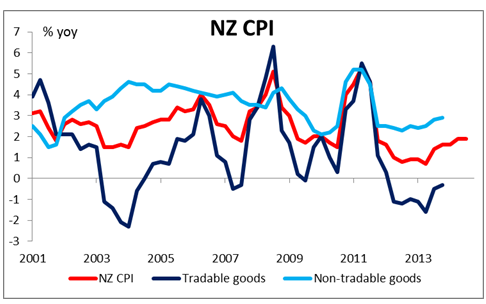
On the other hand, the dollar was sharply lower vs NZD after New Zealand’s Q4 CPI came out as +0.1% qoq instead of -0.1% qoq as the market had expected. The Real Estate Institute of New Zealand (REINZ) national housing price index was down 1.0% mom in December, but as November was a record high and December was still above October’s level, it still appears that the trend is up. Faster inflation, rising house prices and business confidence at a 20-year high make it more likely that the Reserve Bank of New Zealand will raise rates from the record-low 2.5% at the Jan. 30th meeting. The market is now pricing in a 63% chance of a hike at the meeting and the NZD appreciated as a result. I have consistently argued that NZD should be one of the better-performing currencies this year because of the RBNZ’s exceptional monetary policy – the only G10 central bank with a declared tightening bias. It looks like the tightening cycle could begin even earlier than I had expected, which should further support the currency’s outperformance. AUD was also dragged along with NZD to some degree, aided also by a rally in Chinese stocks after the central bank injected cash into the Chinese money market to hold down rates.
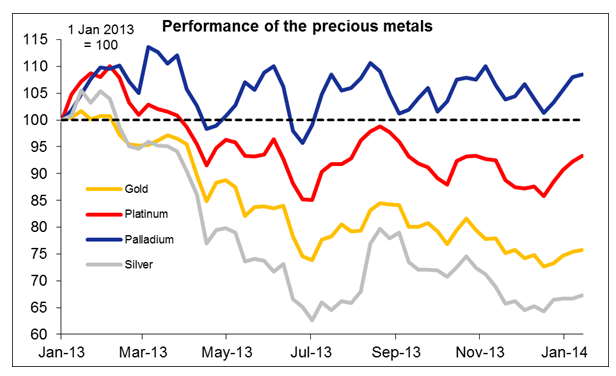
Platinum gained further as miners’ strikes loom, but the strength in platinum did not spill over into gold or silver, which were lower. That’s a bad sign for sentiment for the other precious metals, in my view.
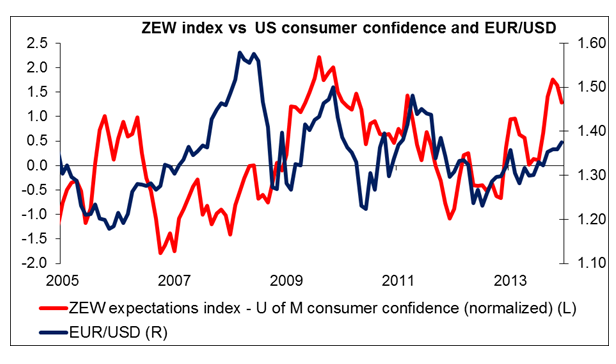
In Europe, the focus today will be on the ZEW survey for January. The current situation index is expected to rise to 35.0 from 32.4 in December and the expectations index to 64.0 from 62.0. An improvement like that might temporarily support the euro. The hit ratio for the current situations index is fairly random – six out of the last 12 have beaten the market forecast, six have missed – but the last five expectations indices have all surprised on the upside as have 9 out of the last 12 months. Does that mean that economists will eventually start predicting this one better, or that peoples’ inability to forecast the indicator offers a chance to make some money? Remember: past performance is no guarantee of future performance. Also today the Confederation of British Industry releases its CBI Trends survey. Total orders are expected to be down, but business optimism is expected to be up. Mixed news suggests little reaction likely from GBP. Also, there are two speakers on the schedule: ECB’s council member Ewald Nowotny speaks to the Austrian business journalists’ club and BoE’s Andy Haldane gives a speech at the Institute for Law and Finance series.
The Market
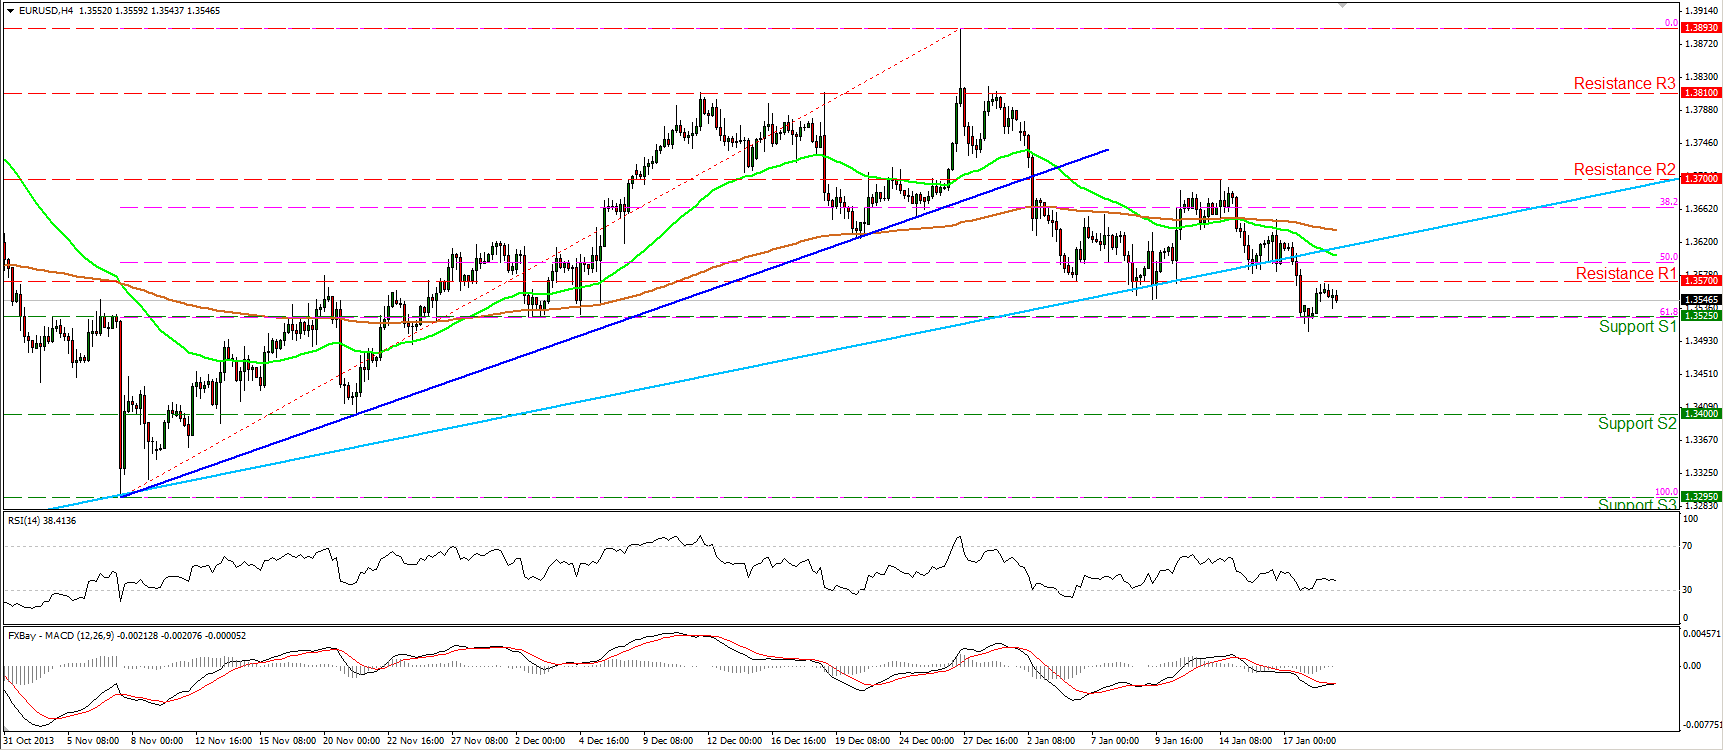
The EUR/USD moved higher after finding support at the 1.3525 (S1) barrier, which coincides with the 61.8% Fibonacci retracement level of the 7th Nov. – 27th Dec. advance. Nonetheless, the advance was stopped slightly below the resistance of 1.3570 (R1) and the pair gave back a portion of its gains. A violation of the 1.3525 (S1) key hurdle may open the way towards the area of 1.3400 (S2). The MACD remains within its negative territory, but seems ready to cross above its trigger line, thus another upward retracement should not be ruled out (especially if today’s ZEW indices come out better than the previous month, as the market estimates). The outlook remains to the downside since the decline from 1.3893 is still in progress.
• Support: 1.3525 (S1), 1.3400 (S2), 1.3295 (S3).
• Resistance: 1.3570 (R1), 1.3700 (R2), 1.3810 (R3).
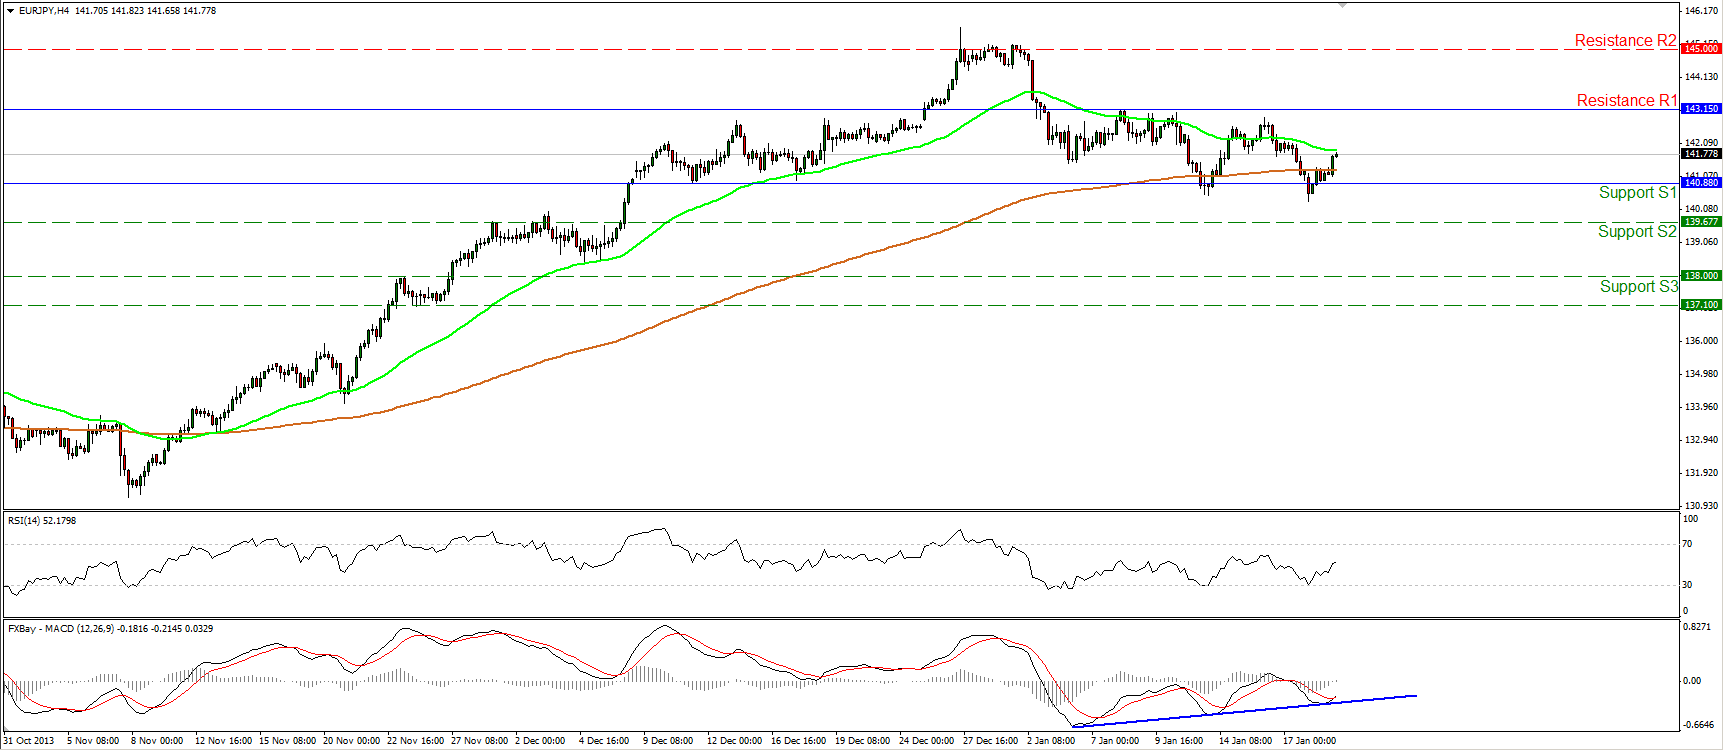
The EUR/JPY found once again support near the 140.88 (S1) barrier and moved higher. The pair remains within its sideways path between that support and the resistance of 143.15 (R1). An upward violation of 143.15 (R1) would argue that the correction from 145.00 (R2) has completed and we may experience a retest of this high. On the other hand, a drop below the lower boundary of the trading range may have larger bearish implications. The MACD, although in bearish territory, follows an upward path and seems ready to cross above its signal line, confirming the weakness of the bears to drive the battle lower, for now. On the daily and weekly charts, the longer term uptrend is still in progress and there is no clear sign of topping yet.
• Support: 140.88 (S1), 139.67 (S2), 138.00 (S3).
• Resistance: 143.15 (R1), 145.00 (R2), 147.00 (R3).
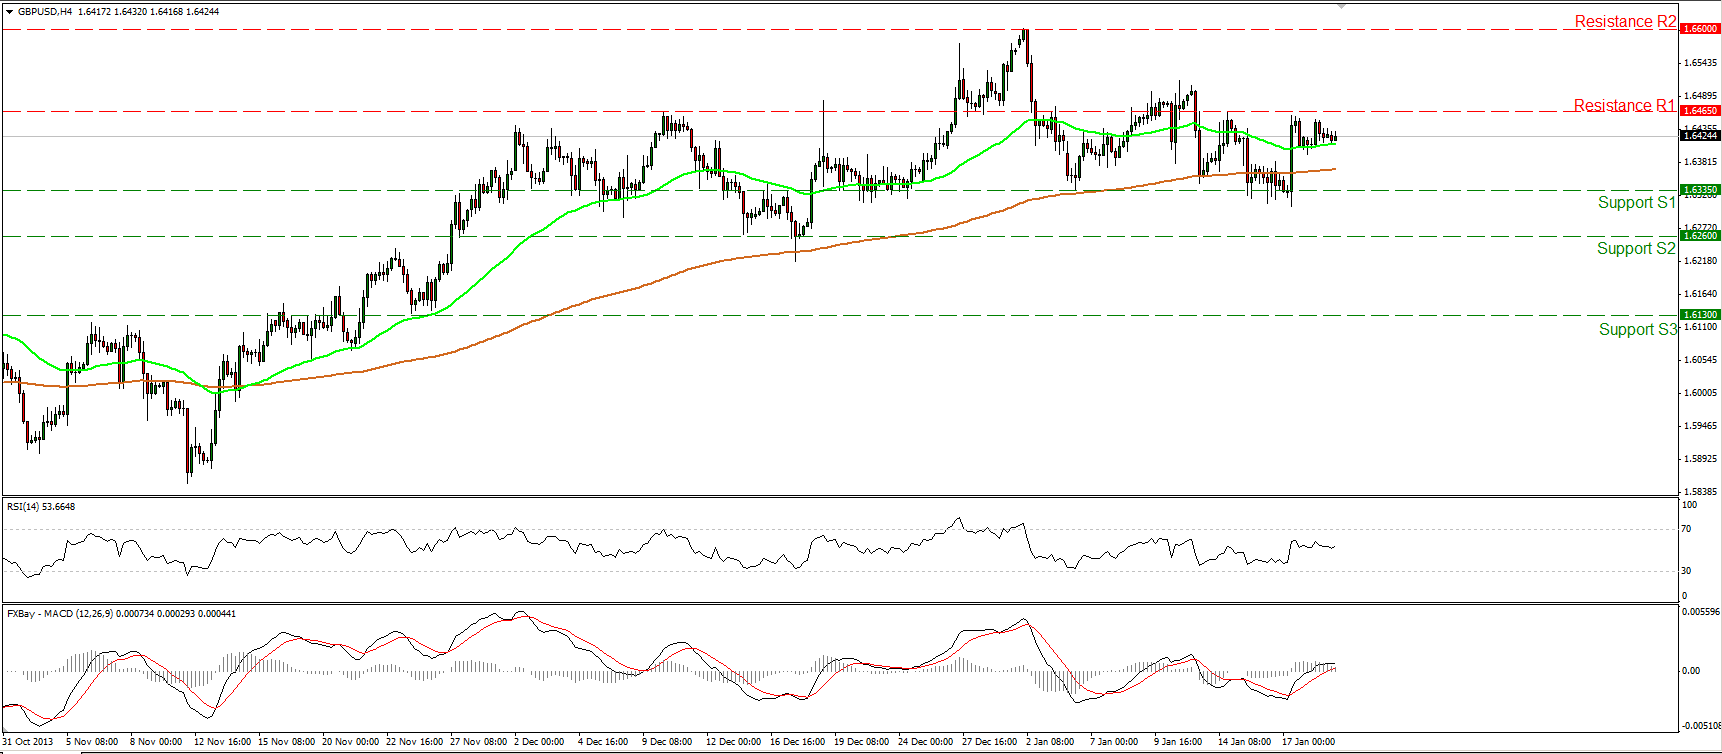
The GBP/USD moved in a consolidative mode, remaining below the resistance barrier of 1.6465 (R1), the violation of which may target once again the highs of 1.6600 (R2). Only a dip below the 1.6335 (S1) would turn the bias to the downside and trigger further declines. Nonetheless, I remain neutral on the pair for now, since it is not in a clear trending phase and I would wait for a clearer picture. On the daily chart, the negative divergence between the daily MACD and the price action is still in effect, indicating that the longer-term uptrend is still losing momentum for now.
• Support: 1.6335 (S1), 1.6260 (S2), 1.6130 (S3).
• Resistance: 1.6465 (R1), 1.6600 (R2), 1.6735 (R3).
Gold
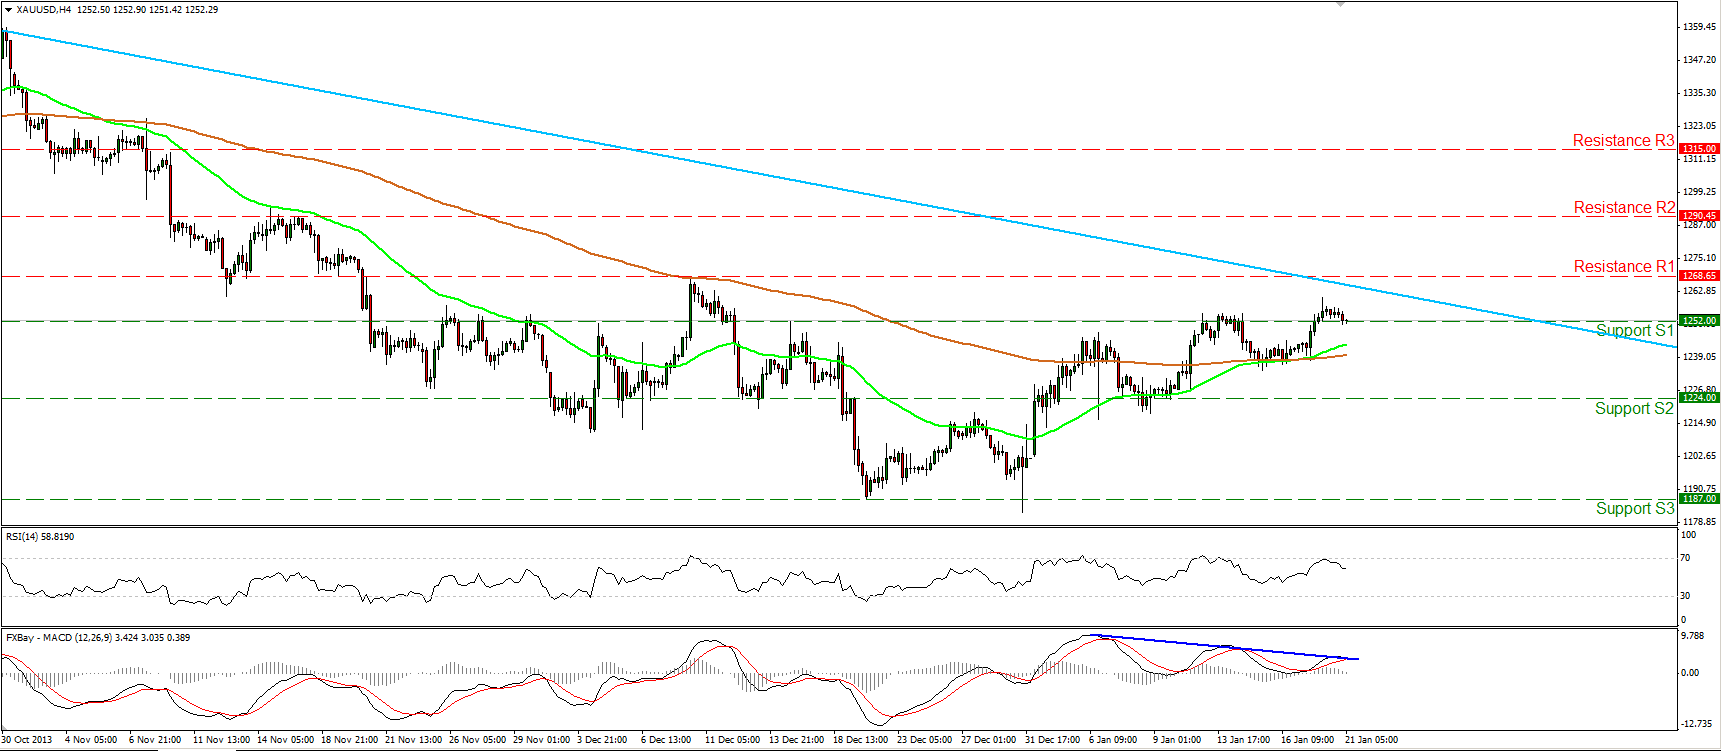
Gold moved slightly lower and at the time of writing is testing once again the 1252 (S1) barrier, as a support this time. A break below it may confirm the inability of the longs to drive the price higher. The negative divergence between the MACD and the price action remains in effect, providing another sign of weakening bullish momentum. On the longer time frames, the longer-term downtrend remains intact, thus I still consider the short-term advance as corrective wave of the major downward path for now. Only a clear violation of the light blue downtrend line and the resistance of 1268 (R1) would be a reason to reconsider our analysis.
• Support: 1252 (S1), 1224 (S2), 1187 (S3).
• Resistance: 1268 (R1), 1290(R2), 1315 (R3).
Oil
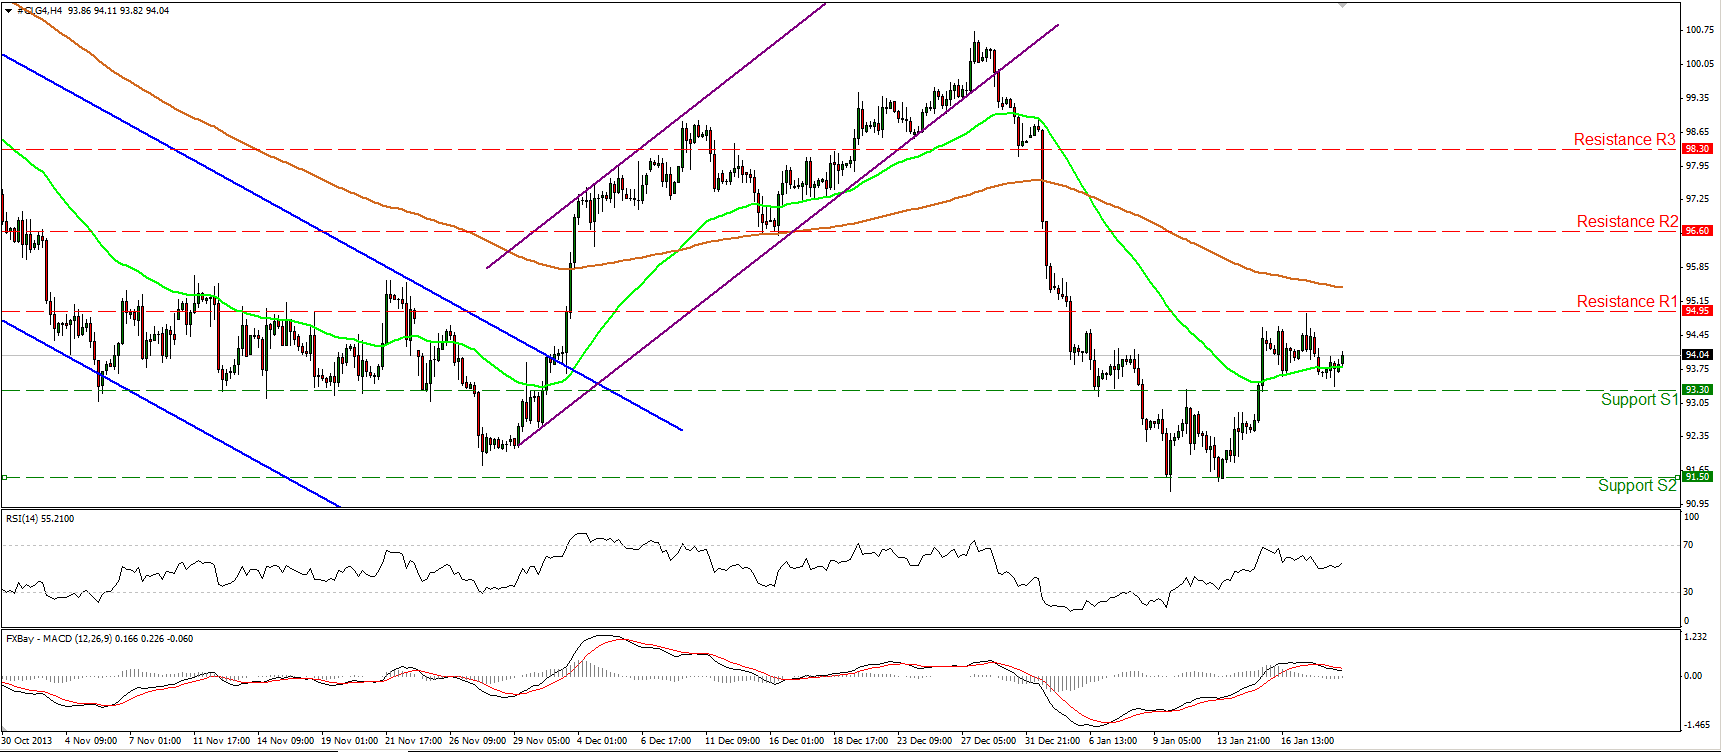
WTI found support near the 93.30 (S1) but failed to violate that level and is back near 94.00. A break above the resistance of 94.95 (R1) may turn the picture positive and trigger extensions towards the next resistance hurdle at 96.60 (R2). Alternatively, a dip below the 93.30 (S1) support may target once again the recent lows of 91.50 (S2).Relying on our momentum studies does not seem a solid strategy for now, since the MACD lies below its signal line, pointing down, while the RSI is pointing upwards.
• Support: 93.30 (S1), 91.50 (S2), 90.15 (S3).
• Resistance: 94.95 (R1), 96.60 (R2), 98.30 (R3).
BENCHMARK CURRENCY RATES - DAILY GAINERS AND LOSERS

MARKETS SUMMARY
Disclaimer: This information is not considered as investment advice or investment recommendation but instead a marketing communication. This material has not been prepared in accordance with legal requirements designed to promote the independence of investment research, and that it is not subject to any prohibition on dealing ahead of the dissemination of investment research.
IronFX may act as principal (i.e. the counterparty) when executing clients’ orders. This material is just the personal opinion of the author(s) and client’s investment objective and risks tolerance have not been considered. IronFX is not responsible for any loss arising from any information herein contained. Past performance does not guarantee or predict any future performance. Redistribution of this material is strictly prohibited. Risk Warning: Forex and CFDs are leveraged products and involves a high level of risk. It is possible to lose all your capital. These products may not be suitable for everyone and you should ensure that you understand the risks involved. Seek independent advice if necessary. IronFx Financial Services Limited is authorised and regulated by CySEC (Licence no. 125/10). IronFX UK Limited is authorised and regulated by FCA (Registration no. 585561). IronFX (Australia) Pty Ltd is authorized and regulated by ASIC (AFSL no. 417482)

