Yesterday Bank of England Gov. Mark Carney ended his six-month experiment with forward guidance, during which he promised not to raise rates as long as unemployment remained above 7%, and returned to a more normal style of policy-making. Rather than making specific promises about what would trigger a re-evaluation of policy, he tried to guide the markets as to how the Bank will eventually unwind its ultra-easy monetary policy. This detailed explanation of the Bank’s “reaction function” – discussing which factors the Monetary Policy Committee (MPC) will look at as it evaluates the economy and what it hopes to accomplish with its policy tools – is essentially a return to focusing on all the variables that influence inflation, which is what monetary policy used to be. It’s “forward guidance” of a sort, that is, explaining what the MPC hopes to see in the future while bearing in mind that its forecasts often don’t come true. So there was a lot of mention of the need for a “gradual” tightening when the time comes and that “appropriate” interest rates will be “materially lower than before the crisis.” But as for a trigger – we now have the Bank’s forecast for 18 different variables. That’s a far cry from the focus on unemployment that existed before. It is in fact more of a return to the kind of policy-making that existed previously, but with the MPC being much clearer about how it would make its decisions and what kind of an “end game” it envisioned for its policy. The market took his statements as suggesting higher interest rates sooner than before and pushed sterling and sterling interest rates up sharply, but Mr. Carney seemed to push back against this conclusion in interviews afterwards, stressing that there was a lot of spare capacity in the system that would preclude any tightening for some time. I believe there could be some profit-taking on sterling after yesterday’s big rise (it’s up about 1% vs both USD and EUR). Longer term, this new system basically means a return to watching all the data every month, not just unemployment, and therefore makes it likely that sterling will become more volatile – and stronger, in my view.
The other big event yesterday was a comment by ECB Executive Board member Benoit Coeure, who said that the ECB is “very seriously” considering negative deposit rates. He will speak again today and the market will be waiting to see if he repeats or amplifies that statement. While that comment was the one that got the most attention, he also made some upbeat comments about the Eurozone economy was recovering in 2013 and how “survey indicators point to a further recovery in 2014.” If he focuses on the upbeat today and fails to elaborate on negative rates, the EUR/USD could rebound somewhat. Also the ECB publishes its monthly report and the market will be looking to see what private sector inflation forecasts are to determine whether inflation expectations are still well anchored. Germany’s final CPI for January is coming out as well.
In the US on the other hand Fed chair Janet Yellen’s testimony was postponed indefinitely because of snow. Given that this week’s heavy snowfall coincides with the survey week for the employment data, we are going to have another round of distorted figures this month that will leave the market (and the Fed) wondering about what the underlying trends are.
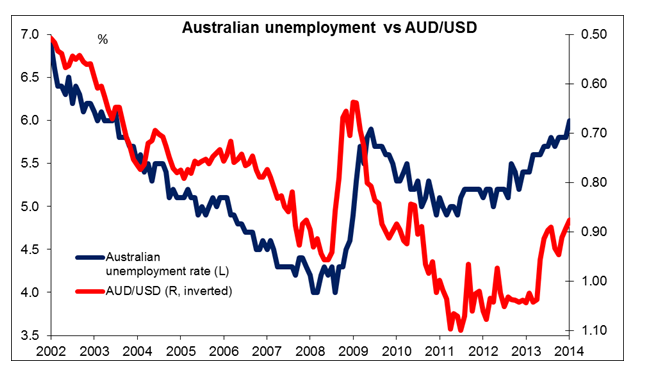
Overnight the AUD fell precipitously after the unemployment rate rose faster than expected in January, back to the levels that prevailed during the depths of the financial crisis in 2009. As you can see from the graph, the trend in Australian unemployment is definitely up – unemployment hasn’t been this high there since 2003 – and the Reserve Bank of Australia must be sensitive to this problem. I still believe the new-found enthusiasm for AUD is too sudden a change in view and I remain bearish on the currency.
Today the Riksbank takes its turn on its rate decision. The market expects the Bank to keep its benchmark rate and its rate path* unchanged. As a result the focus will be on the press conference held by the Governor Stefan Ingves and the Bank’s forecasts on inflation and growth. Sweden’s unemployment rate is is expected to have risen to 8.3% in January from 7.5% in December.
In the US, retail sales are forecast to be unchanged vs +0.2% mom in December, while the excluding autos and gasoline figure is expected to have slowed to +0.1% mom from +0.6% mom the previous month. That could depress the dollar. Initial jobless claims for the week ended on Feb 8 are forecast at 330k vs 331k. That would leave the four-week moving average little changed at 335k vs 334k the previous week and probably wouldn’t affect the markets. In Canada, the new housing price index is estimated to have been up 0.1% in December from an unchanged figure in November. Norges Bank Gov. Olsen will deliver his annual address to the Supervisory Council.
The Market
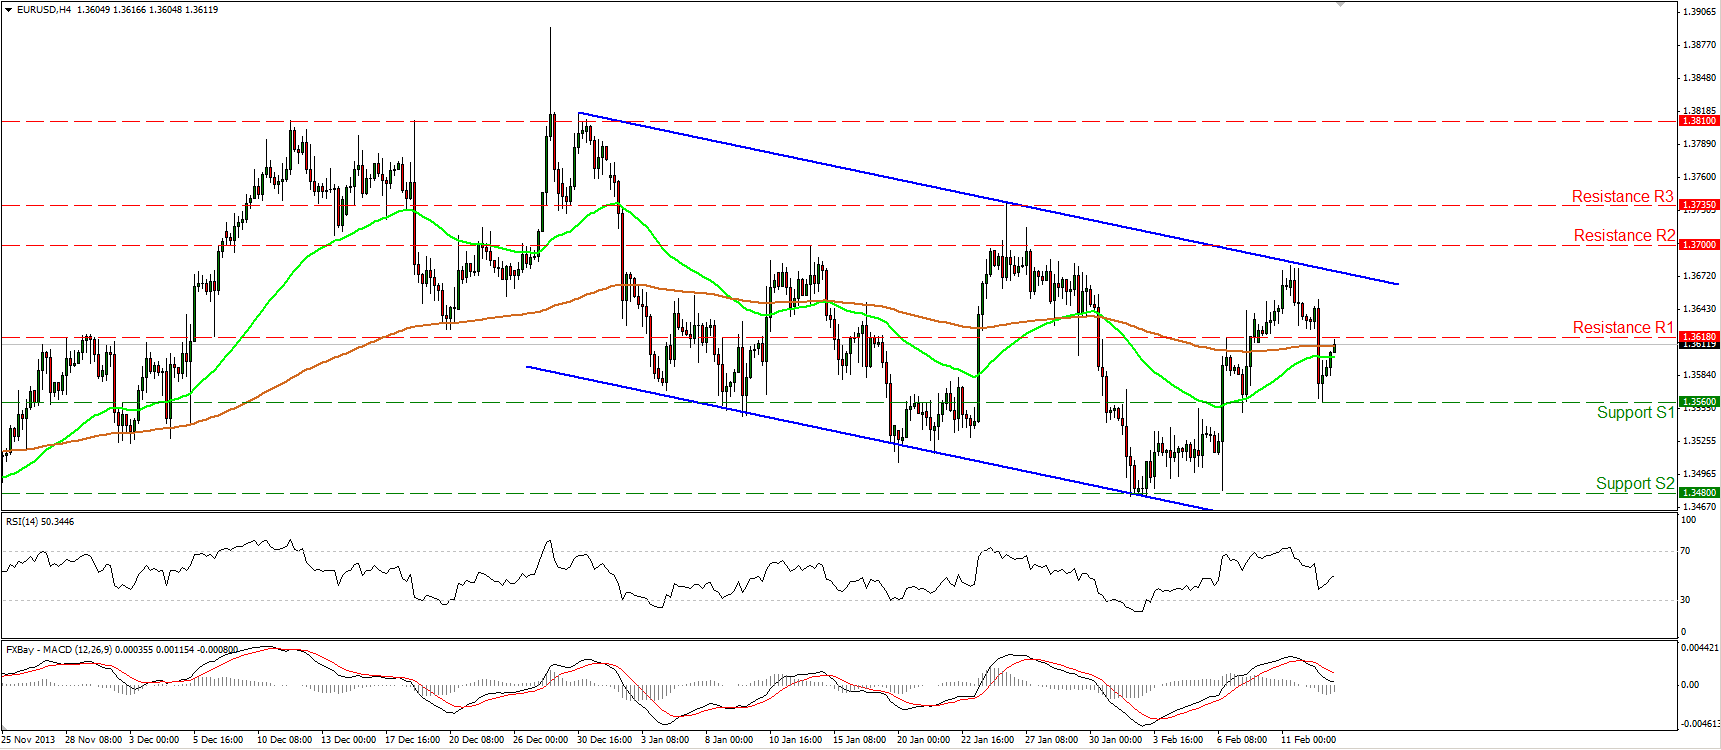
The EUR/USD moved lower and broke below the 1.3618 barrier, confirming the lower high and the shooting star formed on the daily chart by Tuesday’s candle. Despite the false break of the trend line originated from 27th of December (drawn in previous comments), the pair seems to respect the downward sloping channel drawn from the highs of 30th Dec. The fall was halted by the 1.3560 (S1) support and during the Asian morning the rate recovered somewhat and is currently testing once again the 1.3618 (R1) level, as a resistance this time. The structure of lower highs and lower lows is still in place and since the price is trading within the channel, the path remains to the downside. Only a break above 1.3700 (R2) may be a first indication that the direction has changed and the test at 1.3560 (S1) was a higher low.
• Support: 1.3560 (S1), 1.3480 (S2), 1.3400 (S3).
• Resistance: 1.3618 (R1), 1.3700 (R2), 1.3735(R3).
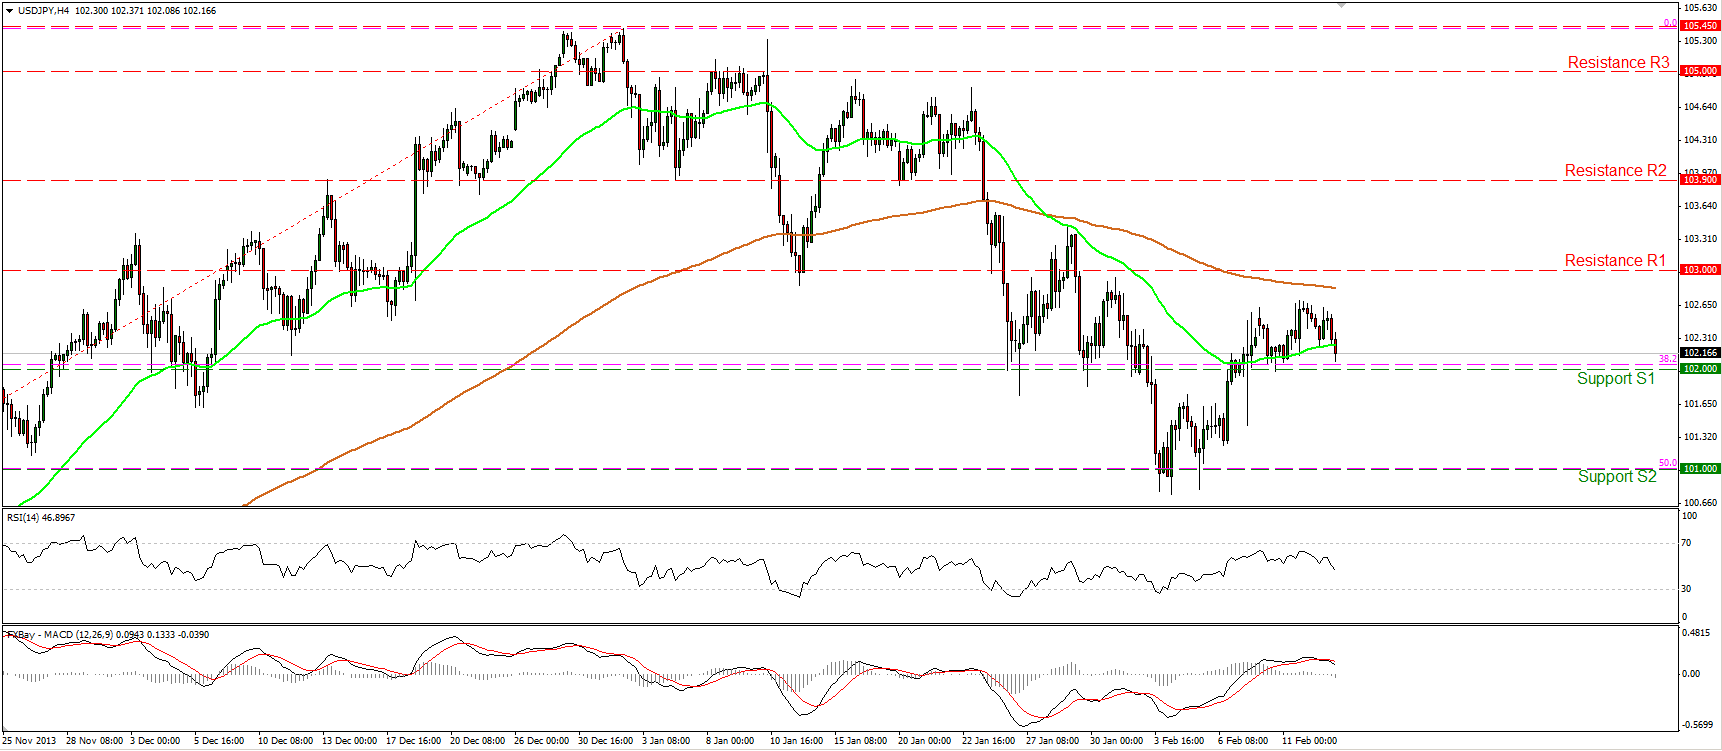
The USD/JPY moved lower and is once again struggling near the support level of 102.00 (S1). A clear dip below that support may challenge once more the support at 101.00 (S2) which coincides with the 50% retracement level of the 8th Oct. - 2nd Jan. advance. On the other hand, an upward break of the 103.00 (R1) resistance may argue that the short-term downtrend has bottomed and that it was just a correcting phase of the longer-term upward path. The RSI is pointing down, while the MACD crossed below its trigger line, confirming the weakness of the longs to drive the battle higher, at the moment.
• Support: 102.00 (S1), 101.00 (S2), 100.00 (S3)
• Resistance: 103.00 (R1), 103.90 (R2), 105.00 (R3).
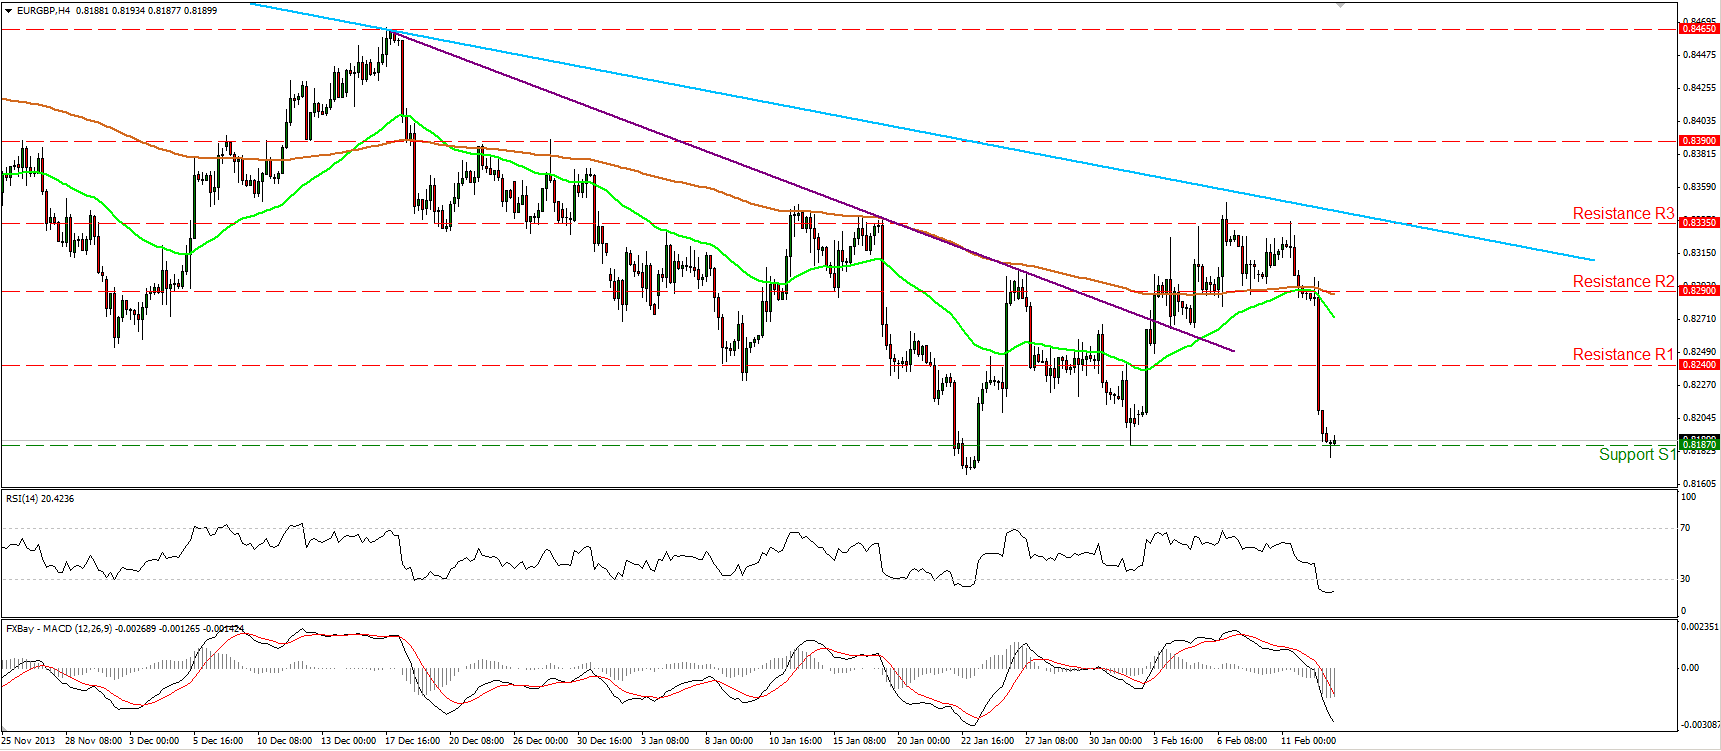
The EUR/GBP collapsed after BoE Governor Carney said that “recovery is gaining momentum”. The rate violated the 0.8240 barrier and reached the 0.8187 (S1) support level. In yesterday’s midday comment I said that I would ignore the oversold reading of RSI since the rate may continue to the downside without retracing. Now that the fall met our support barrier is time to look the oscillator again. The indicator is likely to bottom since it seems to turning its slope and a break above its 30 barrier may confirm an upward corrective wave before the bears prevail again. A clear break below the 0.8187 (S1) support may have larger bearish implications and target the area of 0.8080 (S2).
• Support: 0.8187 (S1), 0.8080 (S2), 0.8035 (S3).
• Resistance: 0.8240 (R1), 0.8390 (R2), 0.8335 (R3).
Gold
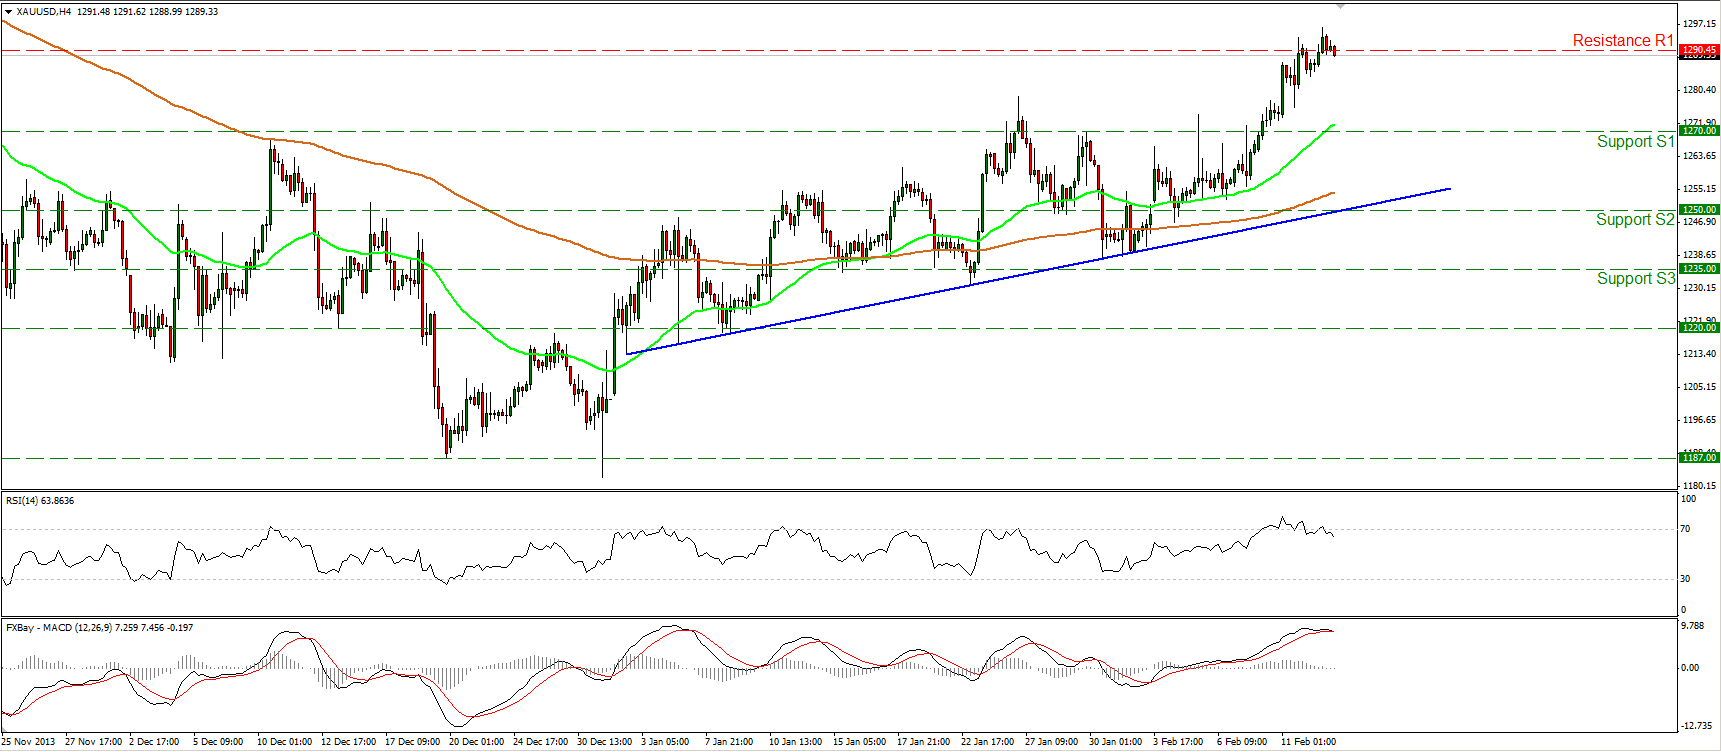
Gold continued consolidating near the barrier of 1290 (R1). This increases the possibilities for a pullback, maybe to test the 1270 (S1) area as a support this time. More indications of weakness are provided by our momentum studies. The RSI exited its overbought zone and is pointing down, while the MACD, although in a bullish territory, seems ready to cross below its signal line. However, since the precious metal is printing higher highs and higher lows, the overall short-term path remains to the upside.
• Support: 1270 (S1), 1250 (S2), 1235 (S3).
• Resistance: 1290 (R1), 1315 (R2), 1340 (R3).
Oil
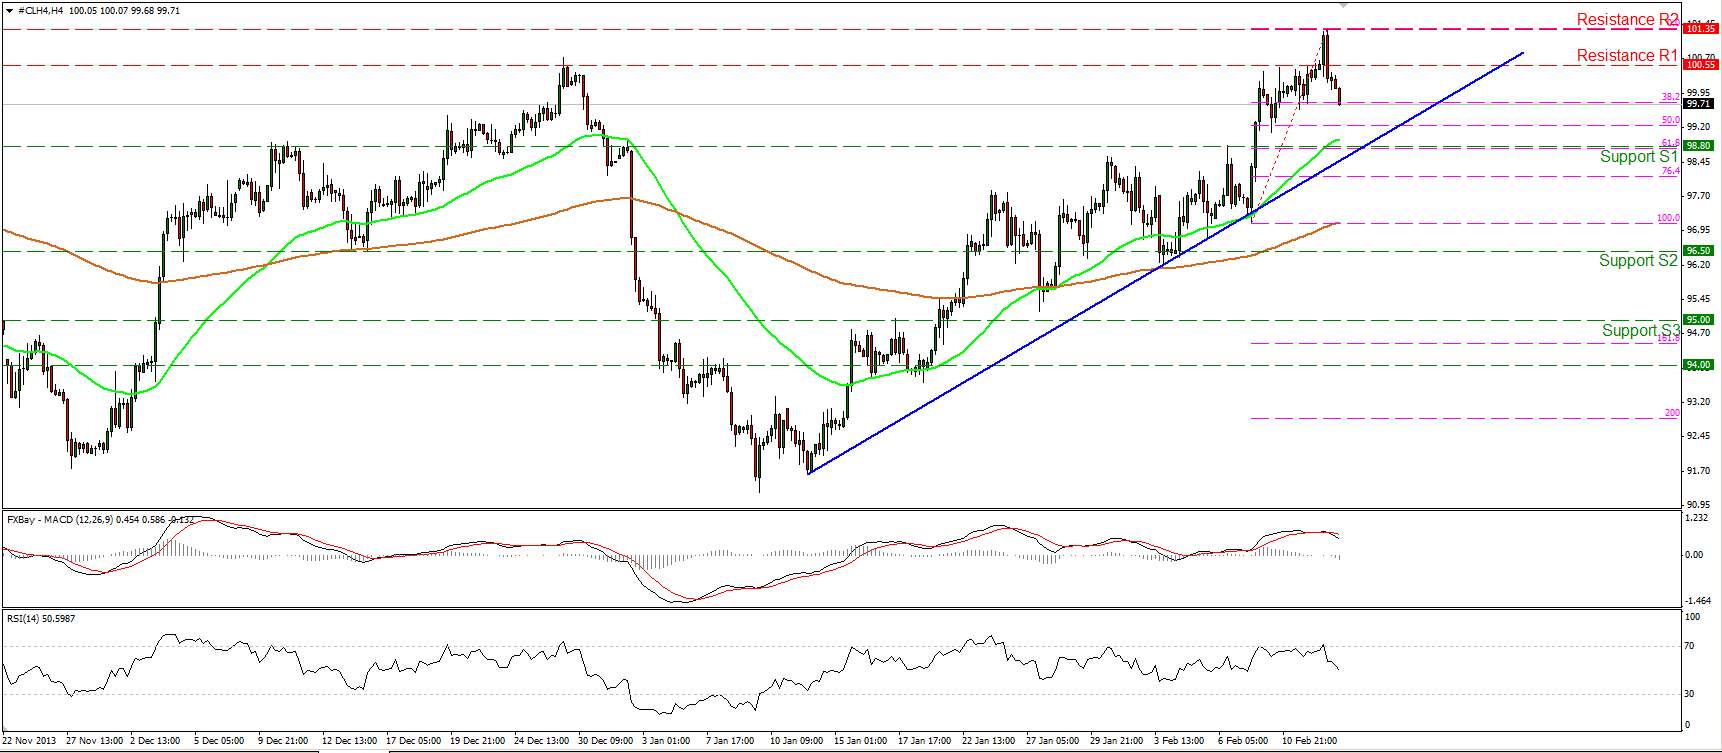
WTI failed to sustain above the 100.55 (R1) barrier and after touching 101.35 (R2) moved lower. Since the price is trading above both the moving averages and the blue uptrend line, I consider the decline to be a corrective wave, maybe to test the area near the 98.80 support, which coincides with the 61.8% retracement level of last Friday’s rally. A clear close below the aforementioned support and the blue trend line may be a first reason to reconsider our analysis. On the daily chart, we can identify a shooting star candle, favoring the continuation of the pullback.
• Support: 98.80 (S1), 96.50 (S2), 95.00 (S3).
• Resistance: 100.55 (R1), 101.35 (R2), 102.00 (R3).
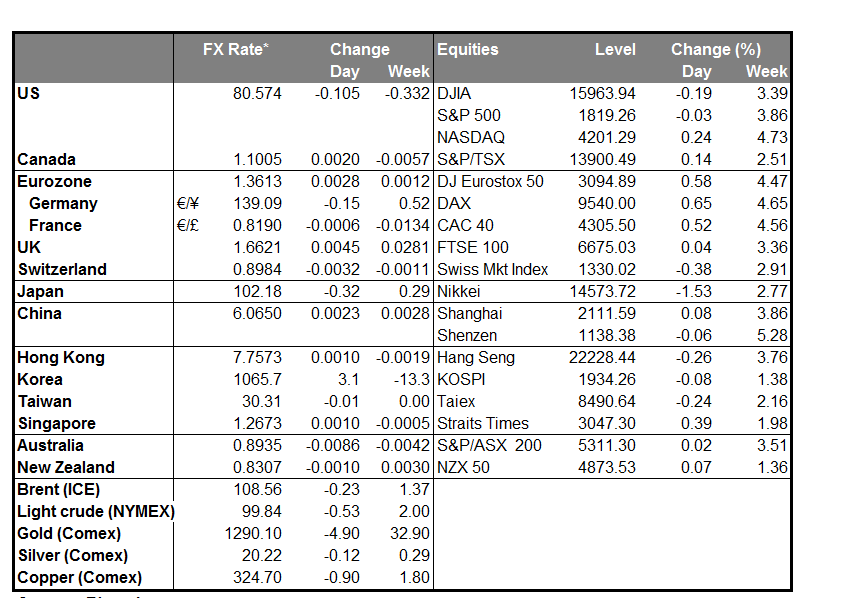
BENCHMARK CURRENCY RATES - DAILY GAINERS AND LOSERS
MARKETS SUMMARY
Disclaimer: This information is not considered as investment advice or investment recommendation but instead a marketing communication. This material has not been prepared in accordance with legal requirements designed to promote the independence of investment research, and that it is not subject to any prohibition on dealing ahead of the dissemination of investment research. IronFX may act as principal (i.e. the counterparty) when executing clients’ orders. This material is just the personal opinion of the author(s) and client’s investment objective and risks tolerance have not been considered. IronFX is not responsible for any loss arising from any information herein contained.
Past performance does not guarantee or predict any future performance. Redistribution of this material is strictly prohibited. Risk Warning: Forex and CFDs are leveraged products and involves a high level of risk. It is possible to lose all your capital. These products may not be suitable for everyone and you should ensure that you understand the risks involved. Seek independent advice if necessary. IronFx Financial Services Limited is authorised and regulated by CySEC (Licence no. 125/10). IronFX UK Limited is authorised and regulated by FCA (Registration no. 585561). IronFX (Australia) Pty Ltd is authorized and regulated by ASIC (AFSL no. 417482)

