Central bank policy leads the market
The dollar was generally lower this morning although without any US-specific news to move the currency. US stocks, bonds and Fed Funds futures were little changed and hence gave no clear direction to the market.
AUD was the biggest gainer after Q4 inflation came in much higher than expected at +0.8% qoq, vs a forecast of +0.4%. This lifted the yoy rate of change to 2.7%, meaning it’s in the upper half of the Reserve Bank of Australia’s 2% to 3% range. That makes it more difficult for the RBA to cut rates in the future, especially as prices for domestic goods and services rose significantly faster (3.7% yoy) than traded goods (+1.0%). As the recent decline in the AUD feeds through to traded goods it will lift the overall inflation rate even further. That may force RBA Gov. Stevens to stop trying to talk down the currency, which has been a major reason why it’s been declining recently. My view is that lower inflation is a global phenomenon, not just local in the Eurozone and US, and that the RBA will not be concerned about a slight uptick one quarter. I therefore do not expect them to stop their campaign for a lower AUD and expect AUD to continue to depreciate.
JPY also gained vs USD overnight after the Bank of Japan refrained from taking any new measures at its Policy Board meeting that ended today. I can’t believe anyone expected them to take any measures so I think this is just an excuse for profit-taking. Since most indicators are generally moving in the direction they expect, I think they are likely to wait until after the hike in the consumption tax later this year to gauge the economy’s response before taking any further measures. I expect the yen to resume weakening in the near future, particularly if (as I expect) the Fed does continue tapering off its bond purchases at this month’s meeting. That should encourage more investors to switch their funding out of USD and into JPY and set the stage for a further decline in the yen.
On the other hand, CAD was the main loser vs USD as the market priced in today’s Bank of Canada meeting, although it recovered from its lows of the day. Economists unanimously expect the BoC to keep its benchmark interest rate at 1.0%, so the focus will be on the press conference afterwards and whether Governor Poloz provides any clues about lowering rates in the future. Confirmation that the BoC favors an easier policy is likely to put further downward pressure on CAD, in my view.
Another round of snow and freezing temperatures in the US gave natural gas another lift upwards.
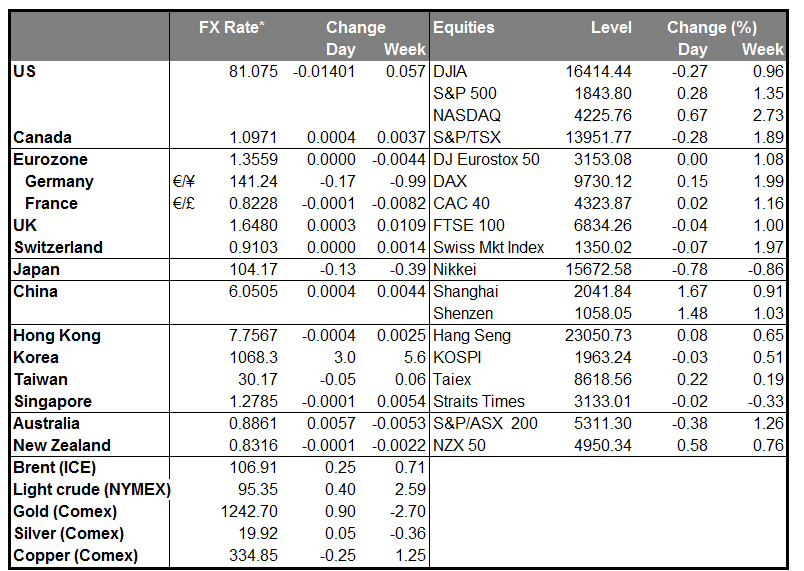
Despite the weaker dollar, gold and silver were both down sharply. Even platinum fell. Again this is a discouraging sign for sentiment towards the precious metals.
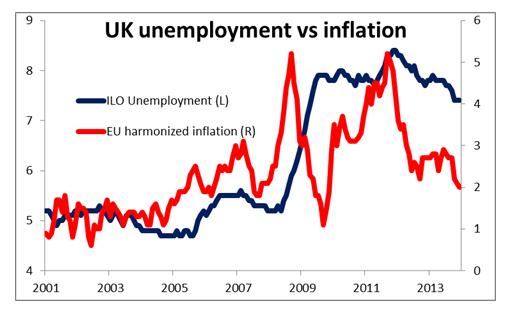
During the European day, investors’ focus will be on the release of UK unemployment rate. The rate is estimated to have fallen to 7.3% in November from 7.4% in October, closer towards the BoE’s 7.0% threshold for considering a rate hike. Although the Bank has said it is willing to maintain a loose policy even after the threshold is reached, especially with no concerns on inflationary pressure, we expect the market to react positive on the release and push GBP higher. We also get the minutes of the Bank of England’s January meeting. From US, the only indicator coming out is the MBA mortgage applications for the week ended on January 17. As for speakers, Riksbank deputy governor Per Jansson will hold a presentation on the economic situation at a seminar and BoE’s Ian McCafferty speaks at the Nottingham Business School.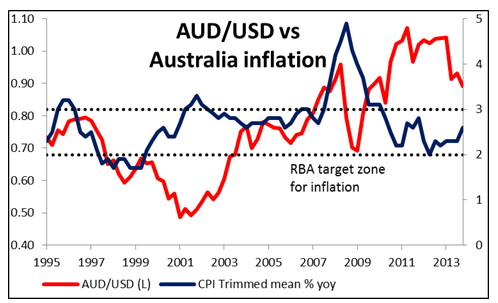
The Market
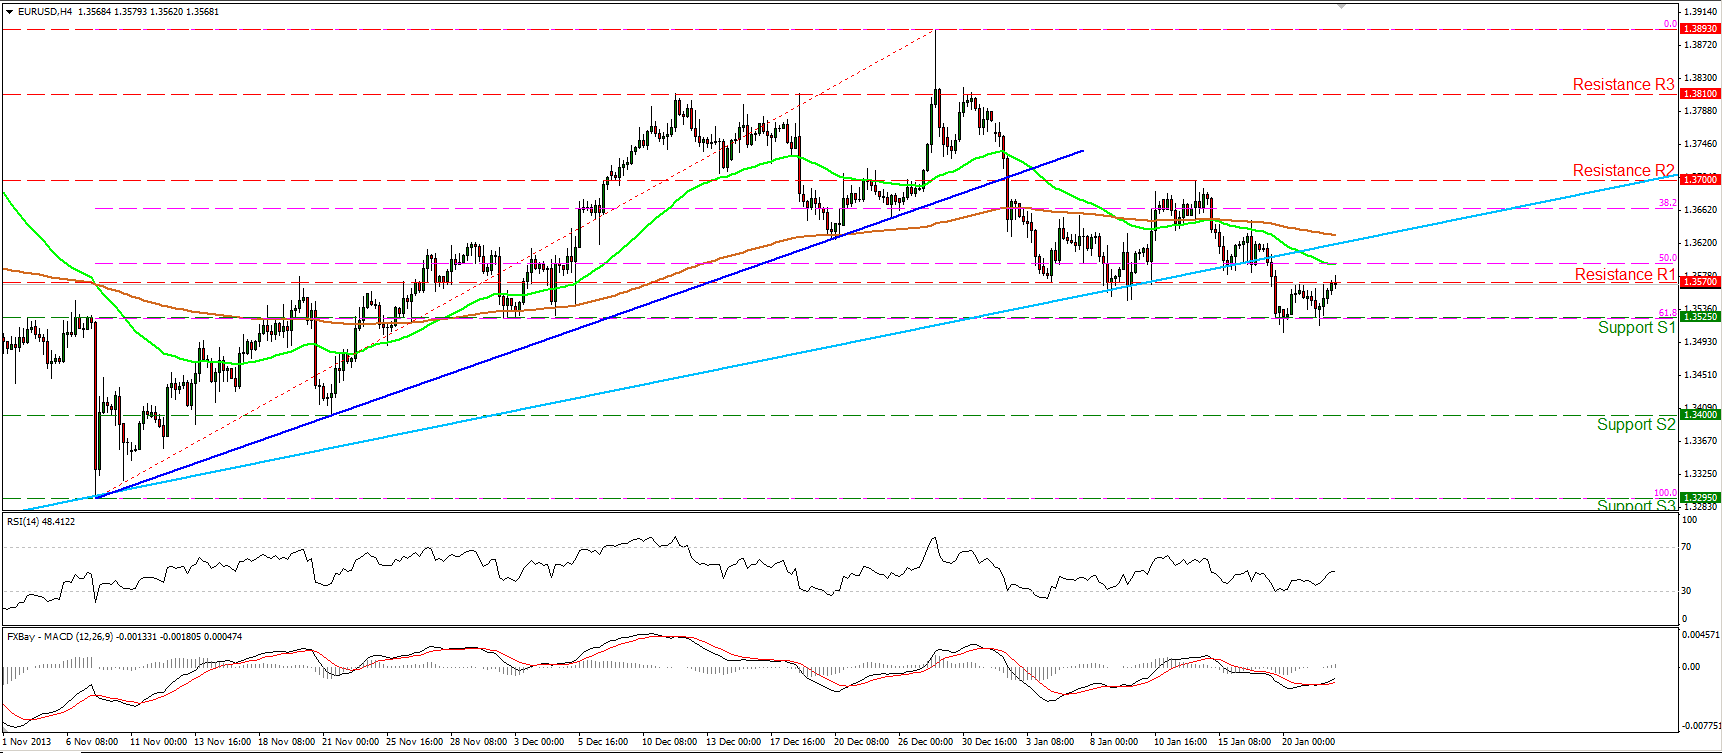
• EUR/USD rebounded once again from the 1.3525 (S1) barrier, which coincides with the 61.8% Fibonacci retracement level of the 7th Nov. – 27th Dec. advance. The currency pair is now testing the resistance of 1.3570 (R1). Nonetheless, I would expect any upward wave to be limited, if it’s not already ended at the aforementioned resistance, and I would consider it as a renewed selling opportunity. A violation of the 1.3525 (S1) key hurdle may open the way towards the area of 1.3400 (S2). The outlook remains to the downside since the decline from 1.3893 is still in progress.
• Support: 1.3525 (S1), 1.3400 (S2), 1.3295 (S3).
• Resistance: 1.3570 (R1), 1.3700 (R2), 1.3810 (R3).
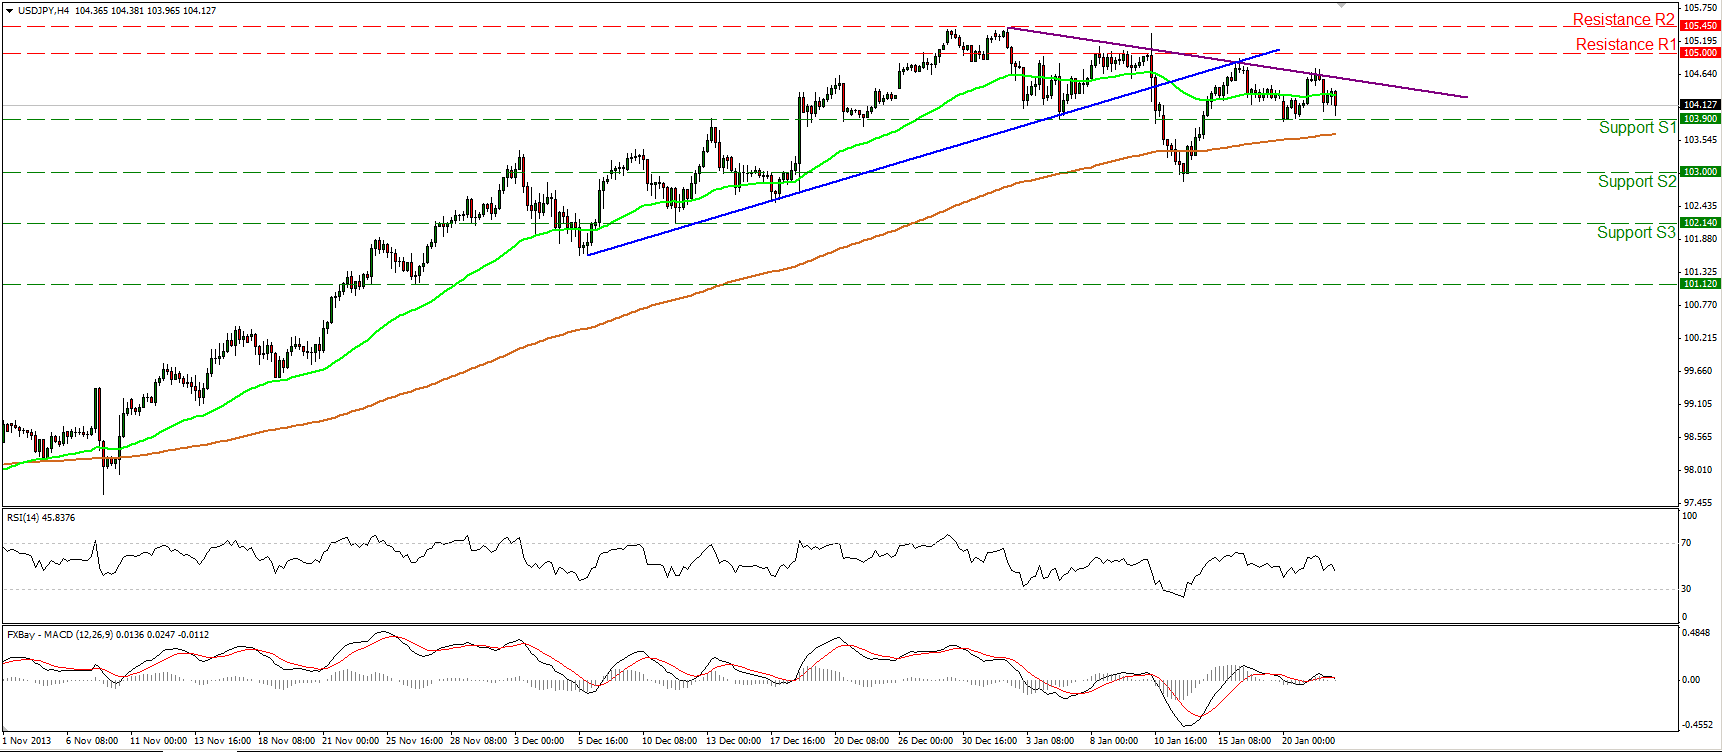
• USD/JPY tested the purple resistance line and moved lower. At the time of writing, the pair is trading slightly above the support of 103.90 (S1) the violation of which may target once again the key level of 103.00 (S2). On the upside, an upward violation of the 105.45 (R2) is needed to signal that the corrective phase has ended and the prevailing uptrend has resumed. The MACD oscillator lies near is moving sideways, near its zero line, indicating neutral momentum at the moment. On the daily chart, the longer term uptrend remains intact and since no significant signs of topping are identified, I would consider the short-term decline as a correcting phase, at the moment.
• Support: 103.90 (S1), 103.00 (S2), 102.15 (S3).
• Resistance: 105.00 (R1), 105.45 (R2), 107.00 (R3).
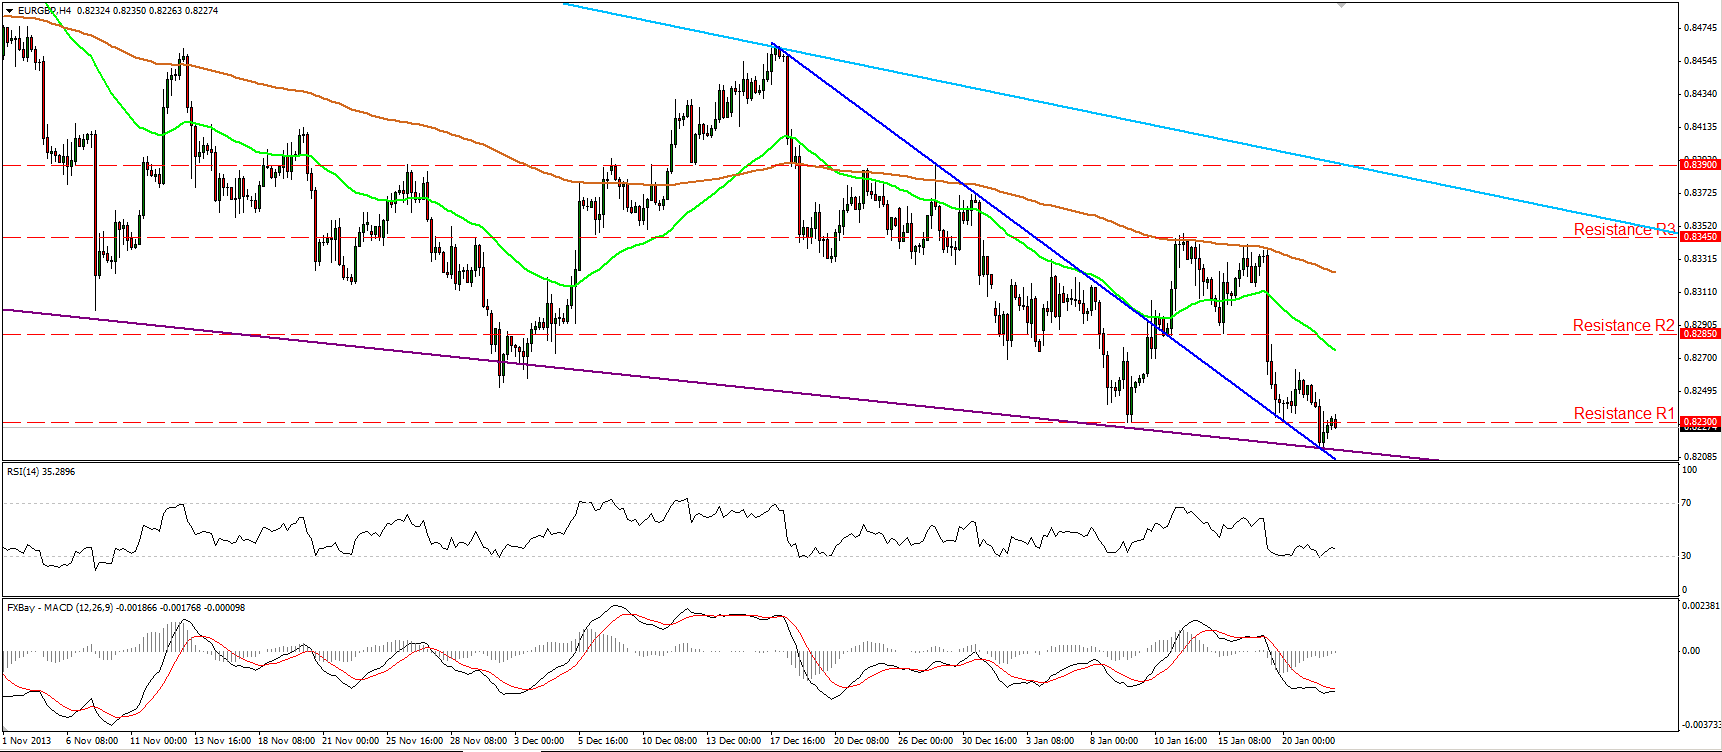
• EUR/GBP broke below the 0.8230 barrier, but met the next hurdle immediately after the break. The pair rebounded at the purple support line (connecting the lows of the price action on the daily chart) and returned to test the 0.8230 (R1) level as a resistance this time. A further decline in the unemployment rate in the UK today may encourage the bears to violate the aforementioned support line and challenge the barrier of 0.8160 (S2). Alternatively, if the price meets strong support at the area is being trading and manage to overcome the 0.8230 (R1) resistance, we might experience extensions towards the next resistance at 0.8285 (R2).
• Support: 0.8160 (S1), 0.8080 (S2), 0.8035 (S3).
• Resistance: 0.8230 (R1), 0.8285 (R2), 0.8345 (R3).
Gold
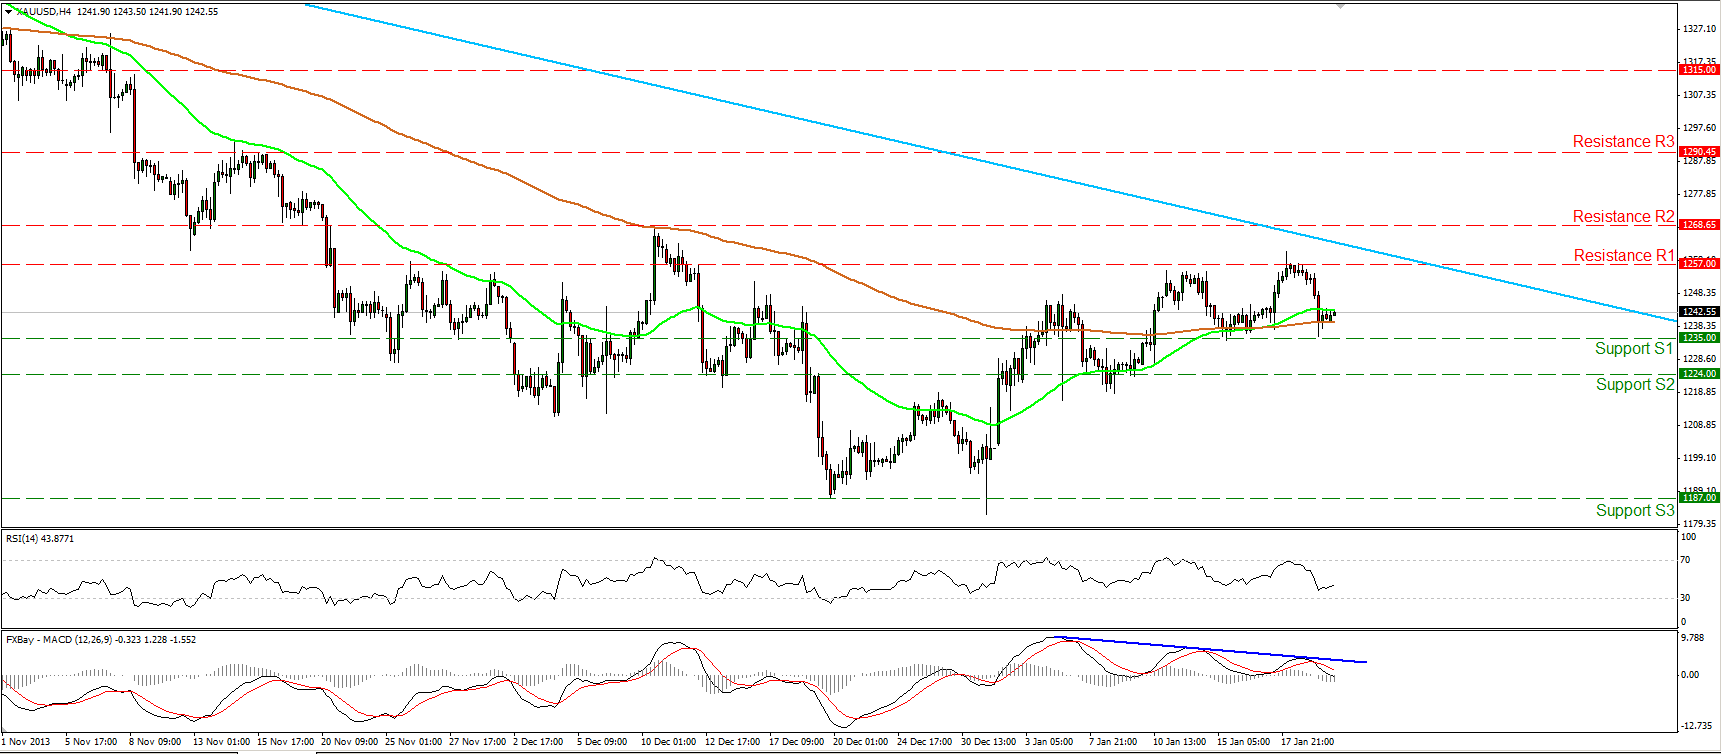
• Gold moved lower on Tuesday after finding resistance at 1257 (R1). The decline was halted by the 200-period moving average, slightly above the support level of 1235 (R1). The MACD oscillator formed a third lower high after touching the blue resistance line and crossed below its trigger line. The oscillator is also trading slightly below its zero line. As a result the negative divergence between the study and the price action is still in effect, and the weakness signs of the recent advance are increasing. On the longer time frames, the longer-term downtrend remains intact, thus I still consider the short-term advance as corrective wave of the major downward path for now. Only a clear violation of the light blue downtrend line and the resistance of 1268 (R2) would be a reason to reconsider our analysis.
• Support: 1235 (S1), 1224 (S2), 1187 (S3).
• Resistance: 1257 (R1), 1268(R2), 1290 (R3).
Oil
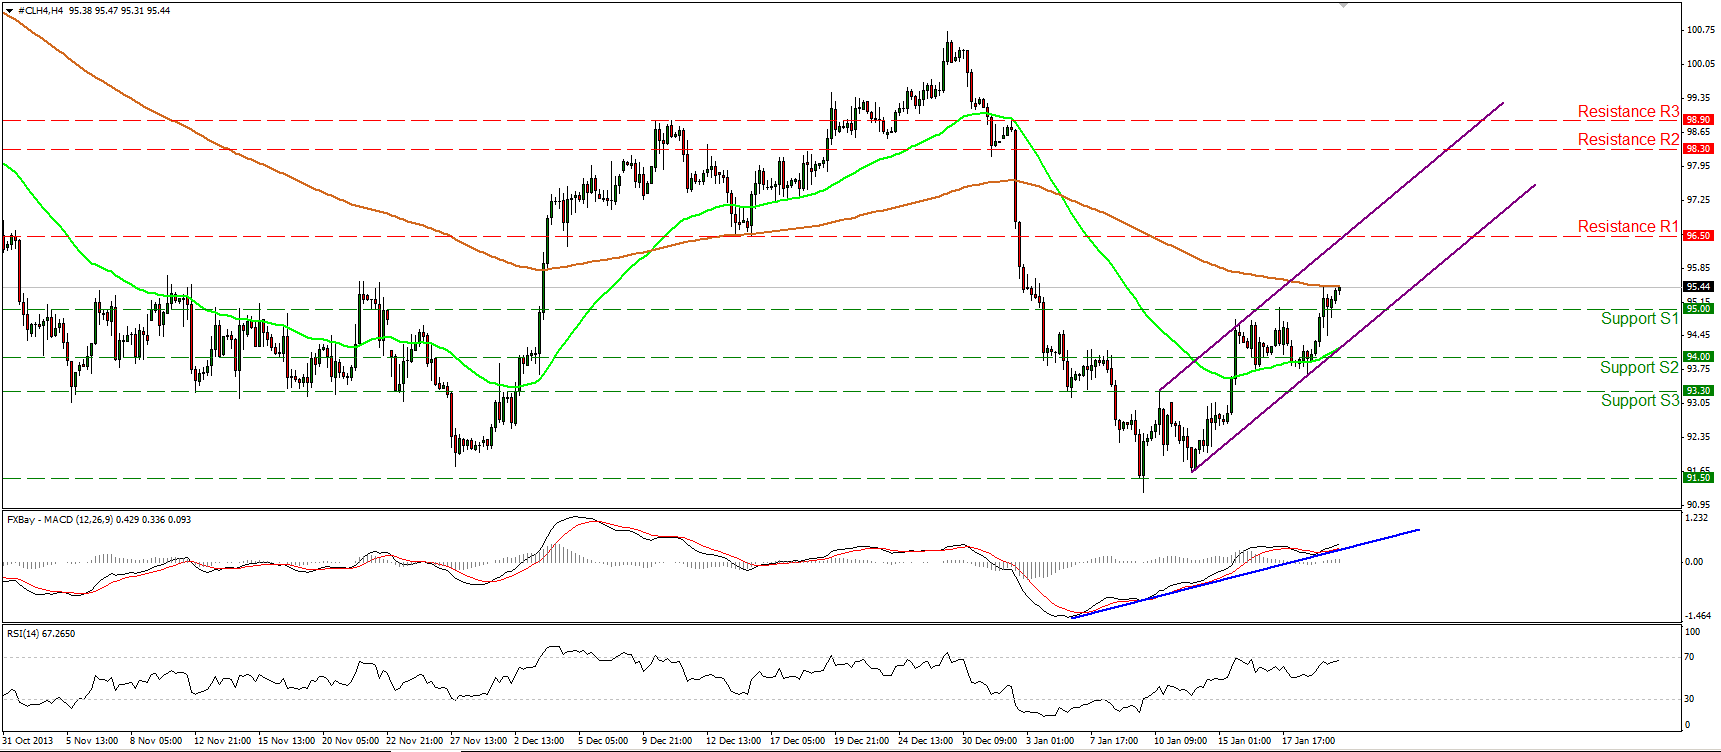
• WTI moved higher yesterday, breaking above the 95.00 barrier. Currently the price is trading near the 200-period moving average and a clear cross above it may challenge the resistance of 96.50 (R1). Oil has formed a higher low and since it managed to overcome the previous high, the outlook is bullish in the near-term. The MACD oscillator continues its upward path and lies above both its zero and trigger lines, confirming the positive picture.
• Support: 95.00 (S1), 94.00 (S2), 93.30 (S3).
• Resistance: 96.50 (R1), 98.30 (R2), 98.90 (R3).
BENCHMARK CURRENCY RATES - DAILY GAINERS AND LOSERS
MARKETS SUMMARY
Disclaimer: This information is not considered as investment advice or investment recommendation but instead a marketing communication. This material has not been prepared in accordance with legal requirements designed to promote the independence of investment research, and that it is not subject to any prohibition on dealing ahead of the dissemination of investment research. IronFX may act as principal (i.e. the counterparty) when executing clients’ orders.
This material is just the personal opinion of the author(s) and client’s investment objective and risks tolerance have not been considered. IronFX is not responsible for any loss arising from any information herein contained. Past performance does not guarantee or predict any future performance. Redistribution of this material is strictly prohibited. Risk Warning: Forex and CFDs are leveraged products and involves a high level of risk. It is possible to lose all your capital. These products may not be suitable for everyone and you should ensure that you understand the risks involved. Seek independent advice if necessary. IronFx Financial Services Limited is authorised and regulated by CySEC (Licence no. 125/10). IronFX UK Limited is authorised and regulated by FCA (Registration no. 585561). IronFX (Australia) Pty Ltd is authorized and regulated by ASIC (AFSL no. 417482)

