On November 2016, CVR Energy (NYSE:CVI) made an important low to end a daily correction from 2013 peak, up from there the stock either started a new bullish cycle to take it toward new all time highs or it’s just doing a 3 waves bounce.
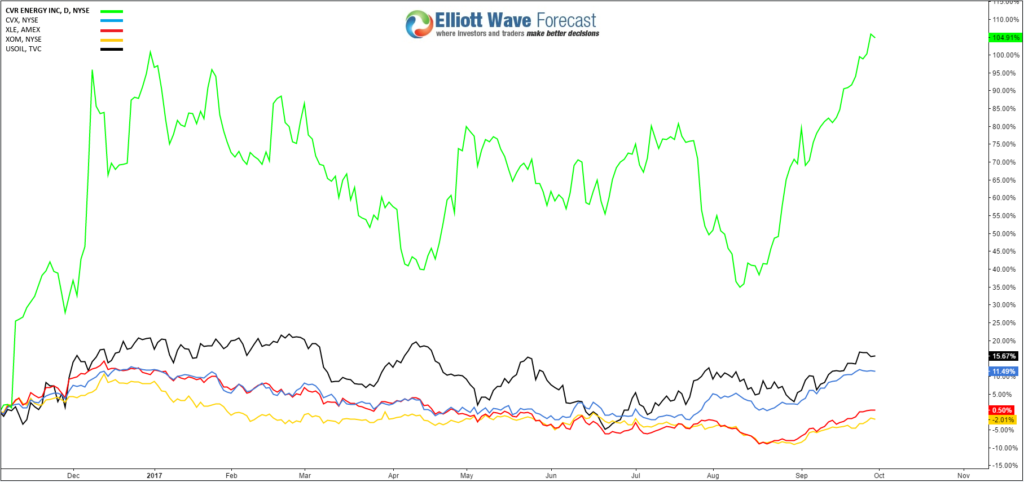
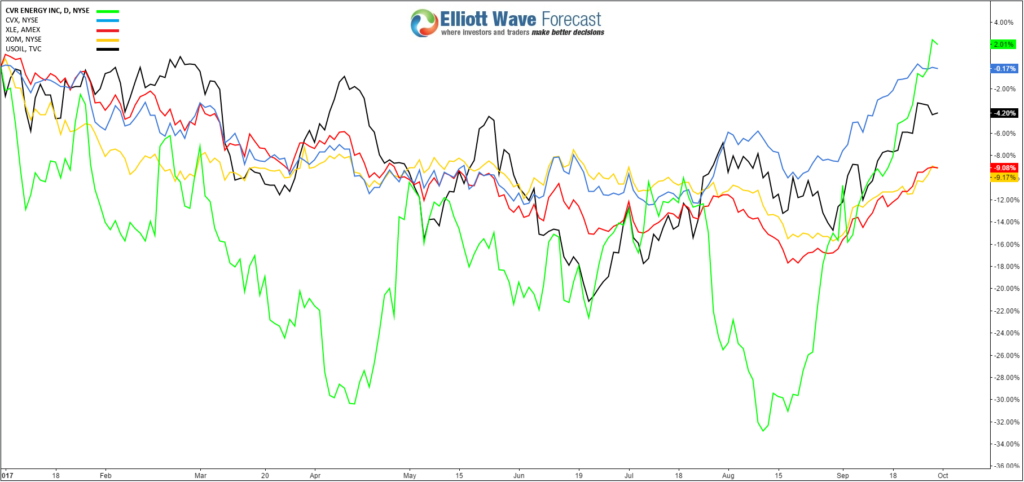
We can notice that since last year low, CVI has outperformed the energy sector instruments including crude oil, XLE (NYSE:XLE) and stocks like Exxon Mobil (NYSE:XOM) and Chevron Corporation (NYSE:CVX). CVR Energy is currently up %104 and looking for further gains during the last quarter of the year.

The energy sector was the weakest performer since the start of the year and despite the recent bounce seen since August 2017 low the majority of related instruments remain with a negative gain for 2017 and only CVI has managed to move back to the positive territory last week leading the move higher.

Daily Chart Elliott Wave View
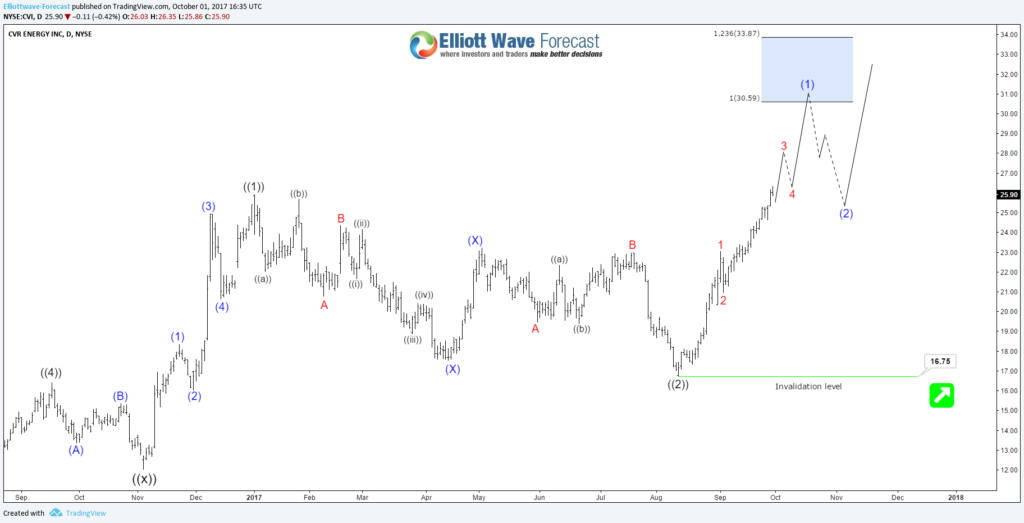
We mentioned on our previous article about CVI, how the stock is turning bullish after the first leg was unfolding as 5 waves and last week we had the confirmation with the break above January 2017 peak. So currently, CVI is showing a bullish sequence from 11/3/2017 low supporting more upside toward the first target at equal legs area $30.6 – $33.9 and from there we can decide the next path depending on the structure of the correction.

The stock can keep extending as an impulsive 5 waves structure with extension toward 161.8% fib ext area $39 or can end the move as 3 waves zigzag structure before a pullback take place against $12.03 low then higher again. Consequently, the potential scenarios that can take place has a bullish outcome for the stocks and we recommend members to remain on the long side.
