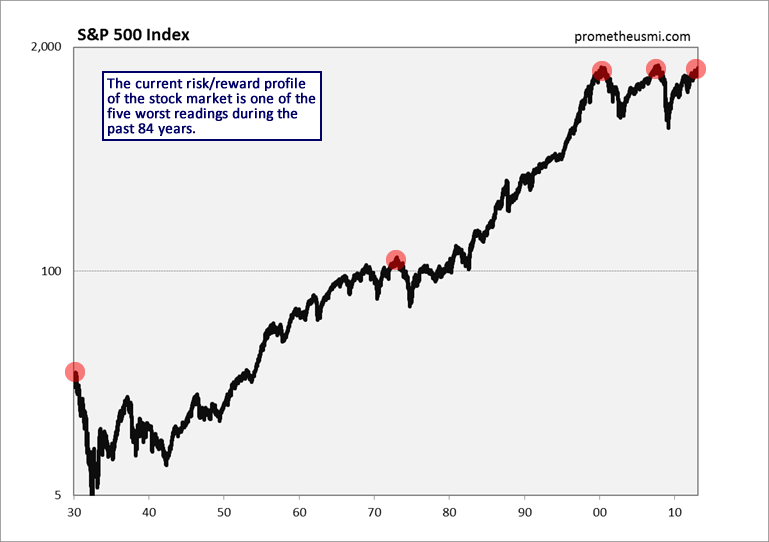
During the past two months, the large basket of fundamental, technical, internal and sentiment data that our computer models use to calculate our Secular Trend Score (STS) and Cyclical Trend Score (CTS) has indicated that stock market investment risk has risen to one of the highest levels during the last 84 years.
Our computer models are not alone in warning about the extremely poor risk/reward ratio of the stock market at this time. In his latest weekly commentary, fund manager John Hussman reviews the current level of market overvaluation suggested by the cyclically adjusted price earnings ratio (CAPE) and Tobin’s q metric, which evaluates market value relative to replacement cost.
Overvalued, overbought, overbullish. When in history have we seen the Shiller P/E (S&P 500 divided by the 10-year average of inflation-adjusted earnings) above 23, the S&P 500 over 60% above its 4-year low and 10% above its 52-week average, with investment advisory bears below 20% for at least two weeks running? Three times: the April 2010 peak, the March-May 2011 peak – both followed by corrections approaching 20% – and today. Even if one ignores the historical evidence suggesting the potential for significant bear market losses over the next couple of years, speculators should be aware that present conditions have been hostile even in the context of the recent bull market advance.
I use the word “speculators” intentionally, as the historical evidence overwhelmingly indicates that there is little in the way of “investment” merit at present valuations. See Investment, Speculation, Valuation, and Tinker Bell for a review of the simplistic “forward earnings” measures universally touted by Wall Street here, compared with a range of distinct valuation approaches (including a far more effective use of forward earnings), all which reach nearly identical conclusions, and all which have a dramatically stronger relationship with subsequent market returns at every horizon. Our present estimate of prospective 10-year S&P 500 nominal total returns is now down to about 3.5% annually.
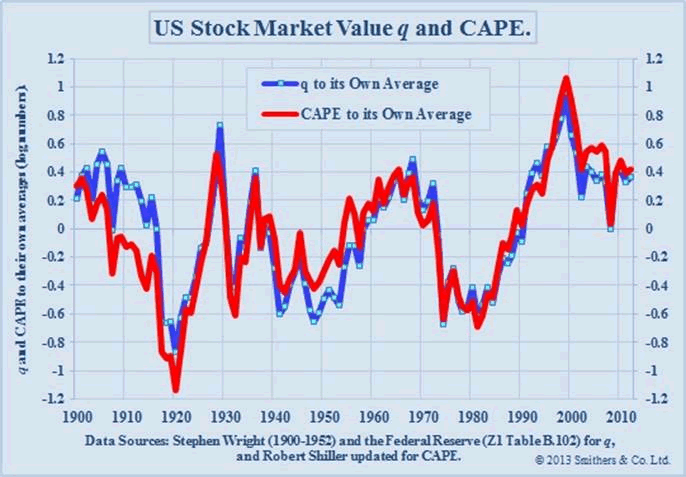
Andrew Smithers out of London provides yet another metric based on Tobin’s q (market value versus replacement cost). The chart below is on log scale, so you have to do a bit of math to translate to percentage over/undervaluation, for example, exp(0.42) = 1.52, or 52% overvaluation. The chart is based on data through the end of 2012. Smithers notes “At that date the S&P 500 was at 1426 and US non-financials were overvalued by 44% according to q and quoted shares, including financials, were overvalued by 52% according to CAPE. With the S&P 500 at 1552 the overvaluation was 57% for non-financials and 65% for quoted shares.” 
Unfortunately, that seems about right. Let’s translate this into an estimate of prospective 10-year total returns, assuming underlying nominal economic growth rate of about 6.3% (which may be optimistic, but is a robust peak-to-peak norm across economic cycles, and is unlikely to be pessimistic), and a dividend yield of about 2.2% on the S&P 500. With that, a 65% overvaluation in quoted shares, reverting to fair valuation a decade from now, would imply a 10-year annual nominal total return on the S&P 500 of 1.063*(1/1.65)^(1/10) + .022 – 1 = 3.3% annually. That’s right in line with the estimates we obtain from a wide range of other historically reliable approaches (historically reliable in italics, because the “Fed Model” is not).
Notice that in 1982, the -0.7 reading on Smithers’ log-scale chart implied that stocks were undervalued by exp(-0.7)-1 = -50%. At that point, with the dividend yield on the S&P 500 about 6.7%, one would have estimated a 10-year prospective total return for the S&P 500 of 1.063*(1/0.5)^(1/10)+.067 – 1 = 20.6% annually. One would have been correct.
In contrast, note that in 2000, the 1.0 reading implied that stocks were overvalued by exp(1.0)-1 = 172%. At that point, with the dividend yield on the S&P 500 at just 1.2%, one would have estimated a 10-year prospective total return for the S&P 500 of 1.063*(1/2.72)^(1/10)+.012 = -2.6% annually. Again, one would have been correct.
Not only are all of these distinct valuation methods quite accurate historically, but we can also fully explain their divergence from simplistic forward earnings approaches, using decades of data on corporate profits, government deficits, and household saving, spanning from the 1940’s to the present. This evidence hammers down two points: corporate profit margins are nearly 70% above their historical norm precisely because of the spectacular combined deficit of government and households, as the deficit of one sector must emerge as the surplus of another; and every bit of historical evidence indicates that elevations in corporate profits are mean reverting, being followed by negative or significantly below-average earnings growth over subsequent years. See Two Myths and a Legend to review the historical evidence in this regard.
- English (UK)
- English (India)
- English (Canada)
- English (Australia)
- English (South Africa)
- English (Philippines)
- English (Nigeria)
- Deutsch
- Español (España)
- Español (México)
- Français
- Italiano
- Nederlands
- Português (Portugal)
- Polski
- Português (Brasil)
- Русский
- Türkçe
- العربية
- Ελληνικά
- Svenska
- Suomi
- עברית
- 日本語
- 한국어
- 简体中文
- 繁體中文
- Bahasa Indonesia
- Bahasa Melayu
- ไทย
- Tiếng Việt
- हिंदी
Current Stock Market Overvaluation According to CAPE And Q Metrics
Published 04/02/2013, 03:09 AM
Updated 07/09/2023, 06:31 AM
Current Stock Market Overvaluation According to CAPE And Q Metrics
Latest comments
Loading next article…
Install Our App
Risk Disclosure: Trading in financial instruments and/or cryptocurrencies involves high risks including the risk of losing some, or all, of your investment amount, and may not be suitable for all investors. Prices of cryptocurrencies are extremely volatile and may be affected by external factors such as financial, regulatory or political events. Trading on margin increases the financial risks.
Before deciding to trade in financial instrument or cryptocurrencies you should be fully informed of the risks and costs associated with trading the financial markets, carefully consider your investment objectives, level of experience, and risk appetite, and seek professional advice where needed.
Fusion Media would like to remind you that the data contained in this website is not necessarily real-time nor accurate. The data and prices on the website are not necessarily provided by any market or exchange, but may be provided by market makers, and so prices may not be accurate and may differ from the actual price at any given market, meaning prices are indicative and not appropriate for trading purposes. Fusion Media and any provider of the data contained in this website will not accept liability for any loss or damage as a result of your trading, or your reliance on the information contained within this website.
It is prohibited to use, store, reproduce, display, modify, transmit or distribute the data contained in this website without the explicit prior written permission of Fusion Media and/or the data provider. All intellectual property rights are reserved by the providers and/or the exchange providing the data contained in this website.
Fusion Media may be compensated by the advertisers that appear on the website, based on your interaction with the advertisements or advertisers.
© 2007-2025 - Fusion Media Limited. All Rights Reserved.
