Since our last report: the currency market has generally moved as expected. However, recently we have received several requests for an update. Since an update of this nature requires a complete review, which is now nearly 50 years of data, it took some time to complete. Nevertheless, after the review, all currencies remain generally on track with the various forecasts made over the years. Currencies are cyclical.
The bull market in the USD began in 2011 as was expected and noted in previous reports. The three wave bull market, all currencies move in three waves, has completed wave A (2013) and wave B (2014), with wave C underway. While wave A was quite small (72.70-84.98), wave B retraced about 50% of that advance (78.93). Since that low wave C took off to the upside rising to 100.71 during its first of many uptrends. This is not unusual. During the previous SC bull market, 1978-1985, the USD also had a small wave A (82.07-94.89) into 1980, but a steeper wave B (84.09). After that low the USD soared for five years, in a series of uptrends, into a 1985 top at 164.72. While we are maintaining our upside target at around 120 by 2017/2018, it is clearly possible that the USD could rise much more than that.
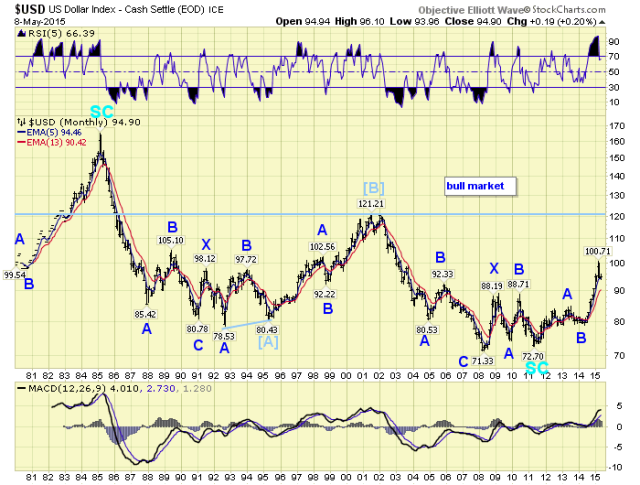
During our review of that SC bull market, and the Cycle [B] bull market during 1995-2001, we observed none of the corrections during those bull markets exceeded the length of the B wave correction by more than one point. For example, during the SC bull market the B wave was 12 points and no corrections during the C wave were larger than 13 points. During the Cycle [B] bull market, the B wave was 11 points and none of the corrections were larger than 11 points. What this observation suggests is that the largest correction we should see during this C wave is seven points, since the B wave was 6 points. This will be put to the test right away as the current correction from the March 100.71 high is already seven points at the recent 93.96 low.
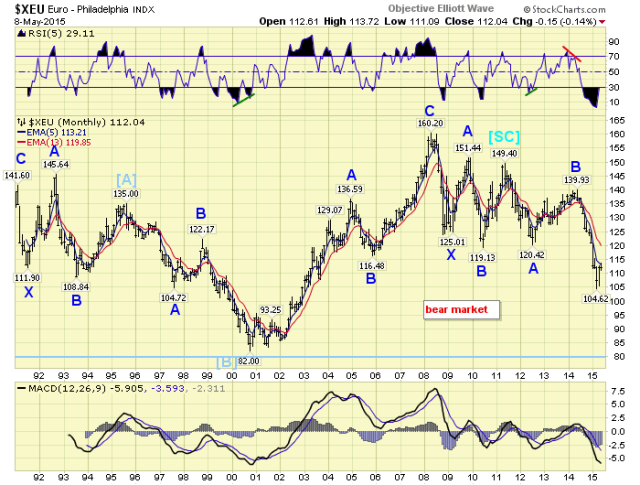
Since the last report the EUR/USD has confirmed its B wave high at 139.93 in 2014, and has dropped to 104.62 during the first downtrend of its C wave. At that low it did get extremely oversold, and we have been targeting a rebound to around 115 before the C wave resumes to the downside. This far it has reached 114. We still expect a downside target in the low 80’s by 2017/2018.
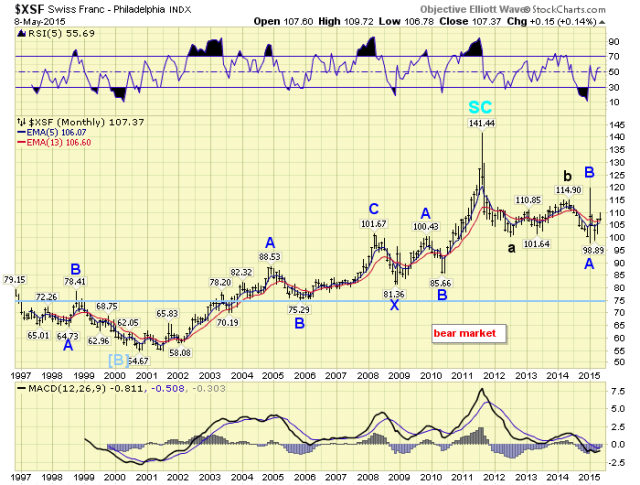
While the USD and EUR had been trending for 10 months the CHF/USD experienced some wild gyrations due to the de-pegging of the CHF from the EUR. In 2011 the CHF had a huge spike to 141.44 to complete its SC bull market. As it began to correct the SNB pegged the CHF to the EUR creating a dramatic selloff. After the peg the CHF generally followed the EUR until the SNB removed the peg this January. This action created a massive short covering rally that lasted only one day. After that the CHF started to drift back down and normalized again. The spike cause an adjustment in the count creating, what appears to be, the shortest B wave in history. Nevertheless, the C wave appears to be underway since the de-pegging. However, as a result of this activity, we have raised the downside target for this bear market from 55 to 75.
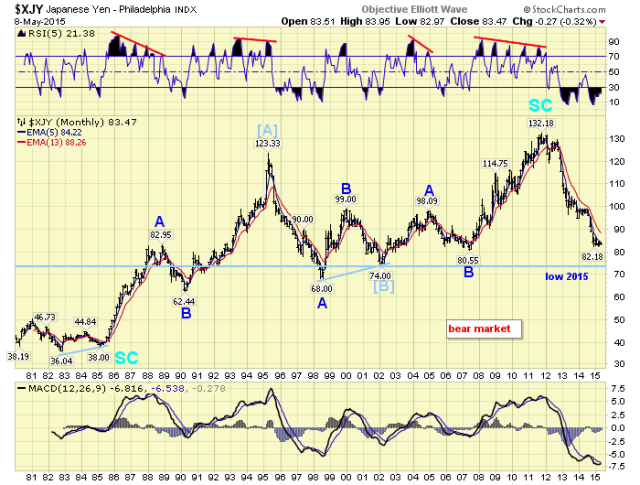
The JPY/USD has remained in an A wave down from its SC high at 132.18 in 2011. We are still expecting this A wave to bottom this year around the 74 level. After that the JPY should have a strong rally for wave B into 2016, then a failed wave C (higher low) into 2017/2018. Historically, the JPY makes its bear market price low earlier than the other currencies.
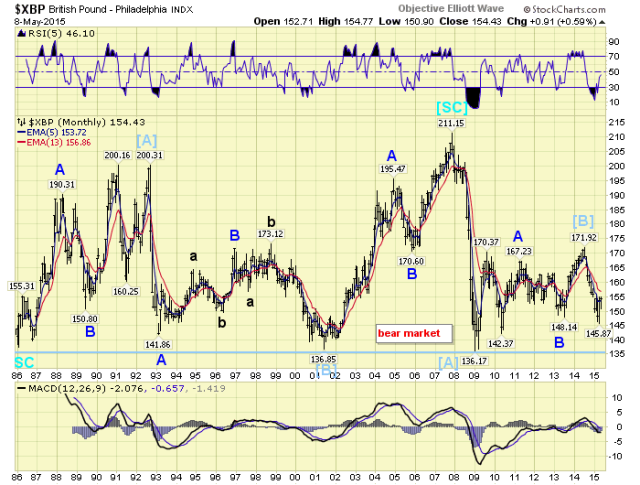
The GBP/USD looks like it has been in a 35 point trading range for the past seven years. It made its SC bull market high earlier than the norm, as it usually does, in 2007. After hitting 211.15 in 2007 it dropped in a large [A] wave to 136.17 by 2008. Then it entered the previously noted trading range, which peaked in 2014 at 171.92. After that high wave [C] kicked in which has hit a low of 145.87 thus far. Our original target was a bear market low at 105 by 2017/2018. But due to the trading range activity we are raising the target to 120.
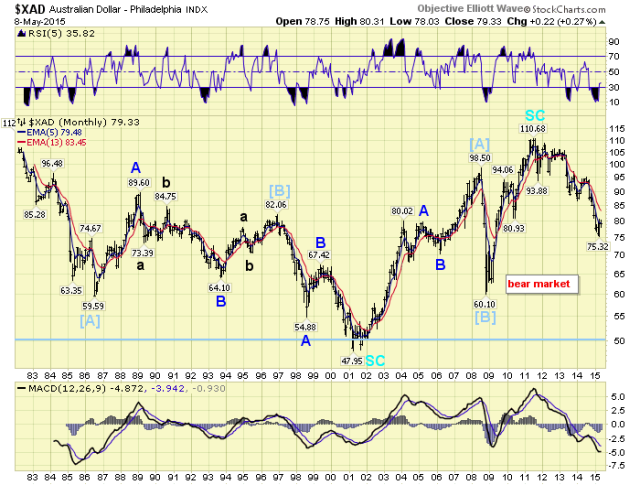
The AUD/USD is one of the three commodity currencies we track. These others being the CAD/USD and the ZAR/USD. Commodity currencies, historically, do not do well during commodity bear markets. And, we have been in a commodity bear market since 2011. During the last commodity bear market, 1980-1998, the AUD dropped from 120 to 48. Even after the USD peaked in 1985, the AUD could only rally to 90 in 1989 before heading to that lower low. In 2011 the AUD peaked at 110.68 and has declined to a recent low of 75.32 before the recent rally. We still expect this large [A] wave to decline to around the 50 level by the year 2017/2018.
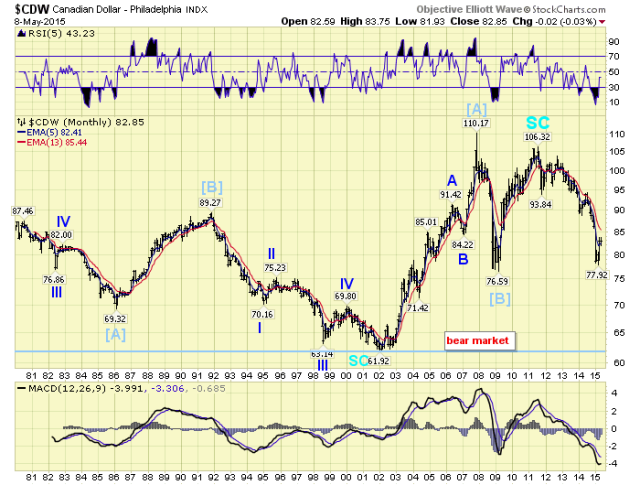
The CAD/USD also has a history of under-performing most major currencies during a commodity bear market. It made a price high in 2008 at 110.17, with the top in some commodities, and then made a lower high in 2011 at 106.32 to end its SC bull market from 2001. Recently it hit a low of 77.92 before entering an uptrend. We still expect the CAD to reach the low 60’s by 2017/2018.