As we begin a new trading year, it’s always interesting to revisit the price action of the last twelve months using the monthly chart, not only to provide historic context, but also to highlight those key levels of support and resistance which are likely to feature in 2015. And here we are considering the four major currency pairs of the AUD/USD, the GBP/USD, the EUR/USD and finally the CAD/USD based on the March futures contract for each.
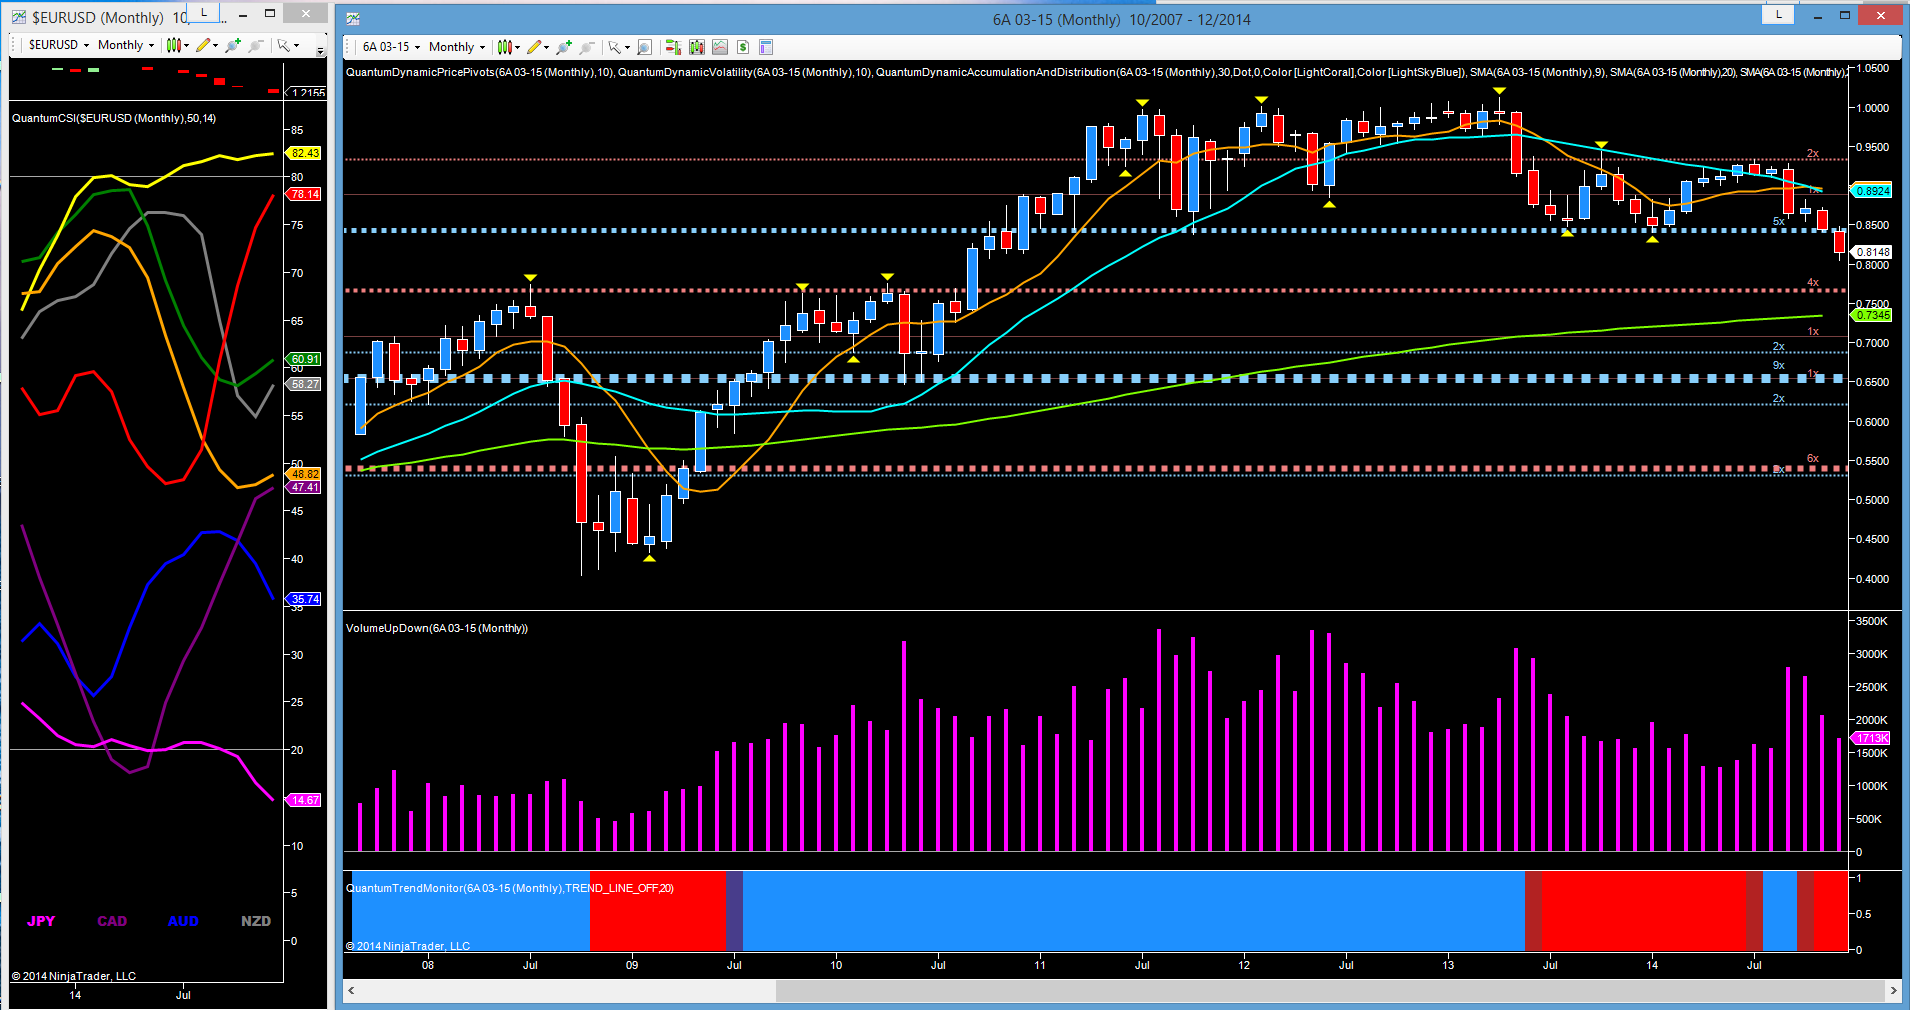
If we start with the AUD/USD, 2014 was a game of two halves, a characteristic of the major pairs as a resurgent US dollar swept aside anything in its path with the dollar index rising for five consecutive months in this time frame. For the Australian dollar the negative tone was given a helping hand by the RBA who publicly declared their support for a weaker currency, and coupled with the prospect of falling interest rates and weak economic data, the pair duly descended, breaking through the key level of support in the 0.8500 in early December. This was the ‘target’ level suggested by the RBA, and since then the AUD/USD has continued lower to currently trade at 0.8148 at the time of writing. With the depth of price congestion now in place overhead, and with little in the way of support below, the pair looks set to continue its bearish tone into Q1 next year with the next level of support now clearly visible in the 0.7800 area, as defined with the red dotted line.
It is also interesting to note the volumes here, with the initial wide spread down candle of September validating and confirming the sustained selling pressure, with October’s weak rally on ultra high volume, merely sending a further strong signal of weakness. November and December have also been associated with high volumes and again validating the price action. With both the technical and fundamental aspects working in tandem, and with the US dollar looking set to move higher next year on the prospect of an interest rate rise, the outlook for the AUD/USD remains heavily bearish for the time being, and will no doubt be accelerated should the RBA also cut rates. This is also confirmed by the currency strength indicator on the left, with the blue line (the AUD) rolling over and with some way to go before reaching the oversold area, with the US dollar (the red line) rising strongly and yet to reach the overbought region at the top of the indicator.

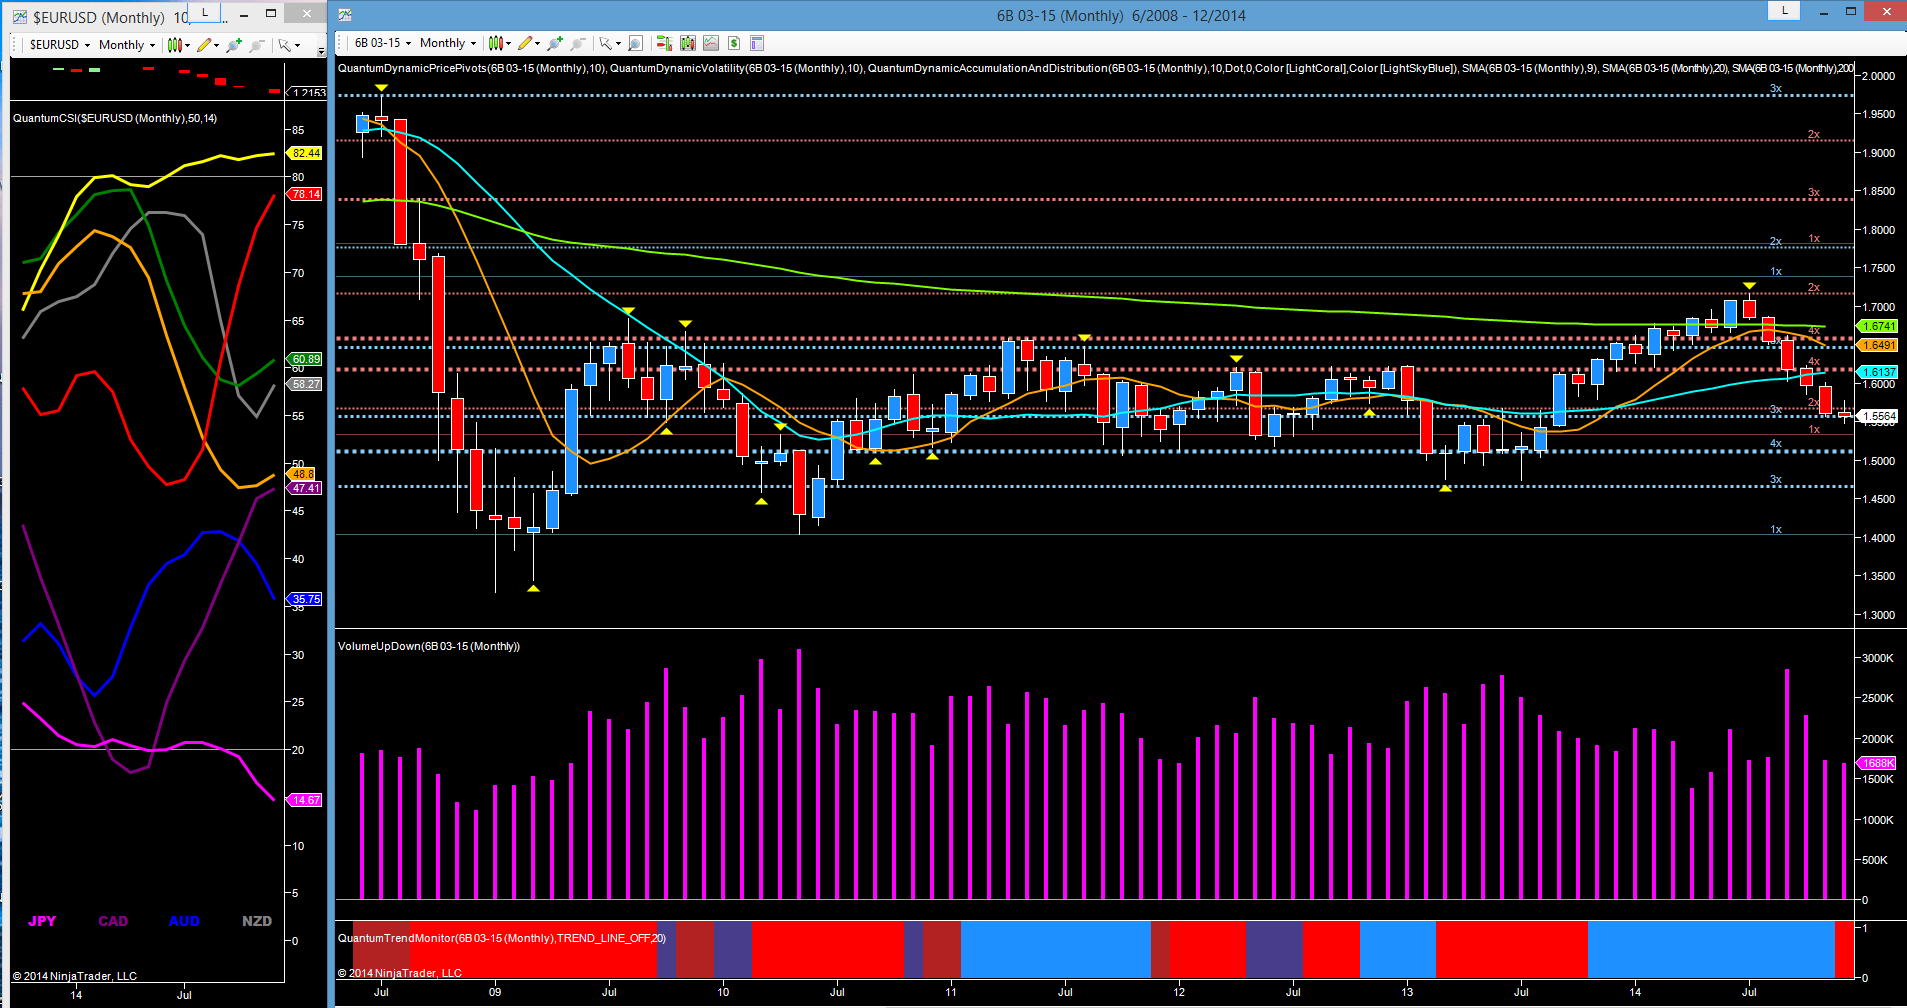
Moving to Cable, the picture here is similar, with the bullish tone of the first half of the year replaced by a heavily bearish one, and as the US dollar has risen for five months on the bounce, so the GBP/USD has fallen in tandem with the volumes here also confirming and validating the negative sentiment for cable, and the reversal here was also signalled with a pivot high. For this pair however, there are three key potential support levels now in relatively close proximity and defined with the accumulation and distribution indicator on the Ninja Trader chart. The first is currently being tested in the 1.5550, but should this fail to hold which looks increasingly likely, then the next level comes into play in the 1.5100 region, a level tested repeatedly throughout 2011 and 2012, and which ultimately provided the springboard for a sustained recovery. However, if this is breached, the third level in the 1.4650 region then becomes a real possibility. Should the US dollar continue its bullish tone (as expected) and with the prospect of an interest rate rise in the UK having diminished, the outlook for cable is bearish once again, with a possible reversal off the 1.5100 region later in the year.
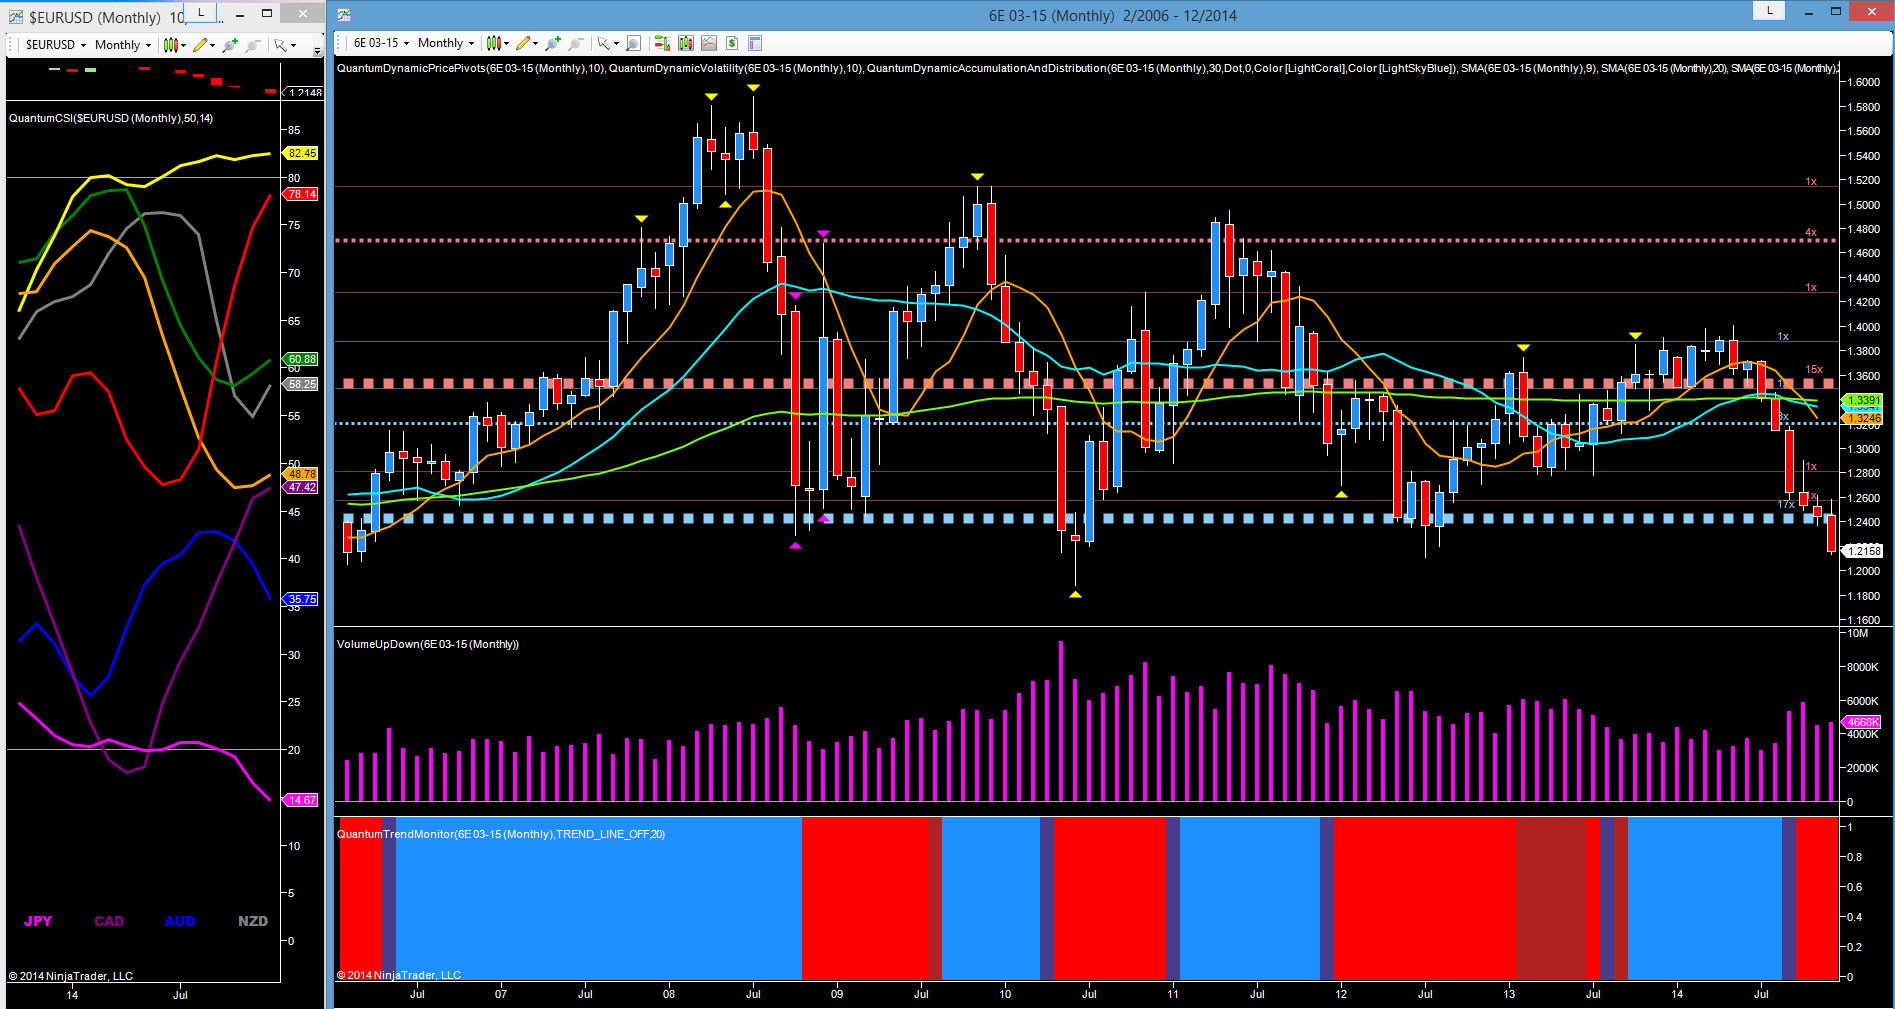
For the single currency, the bearish tone has been even more heavily pronounced in 2014, with the EUR/USD shedding almost 2000 pips since the highs of the summer to currently trade at 1.2165 at the time of writing. As we can see from the chart, December has been a seminal month with the pair breaching the deep area of price accumulation in the 1.2400 area, a level which had been tested and then held 17 times in the past. On this occasion it has been broken and simply confirms the heavily bearish tone for the pair. As with the other majors, one of the driving forces has been the US dollar, but the ECB too has played its part by implementing negative interest rates on very weak economic data, and further cemented by a general lack of action from Mario Draghi. Given the confluence of both technical and fundamental factors, and the sharp contrast between the economies of Europe and the U.S., we can expect to see the pair fall further in 2015, with a test of the 1.1878 low of 2006, now looking increasingly likely.
Finally to the CAD/USD which has had problems of its own as oil has taken center stage, and the battle lines have been drawn between OPEC on one side defending traditional oil supplies, and the alternative energy suppliers on the other. This has resulted in the Canadian dollar behaving as a petrocurrency and reflecting the current woes in the oil market.
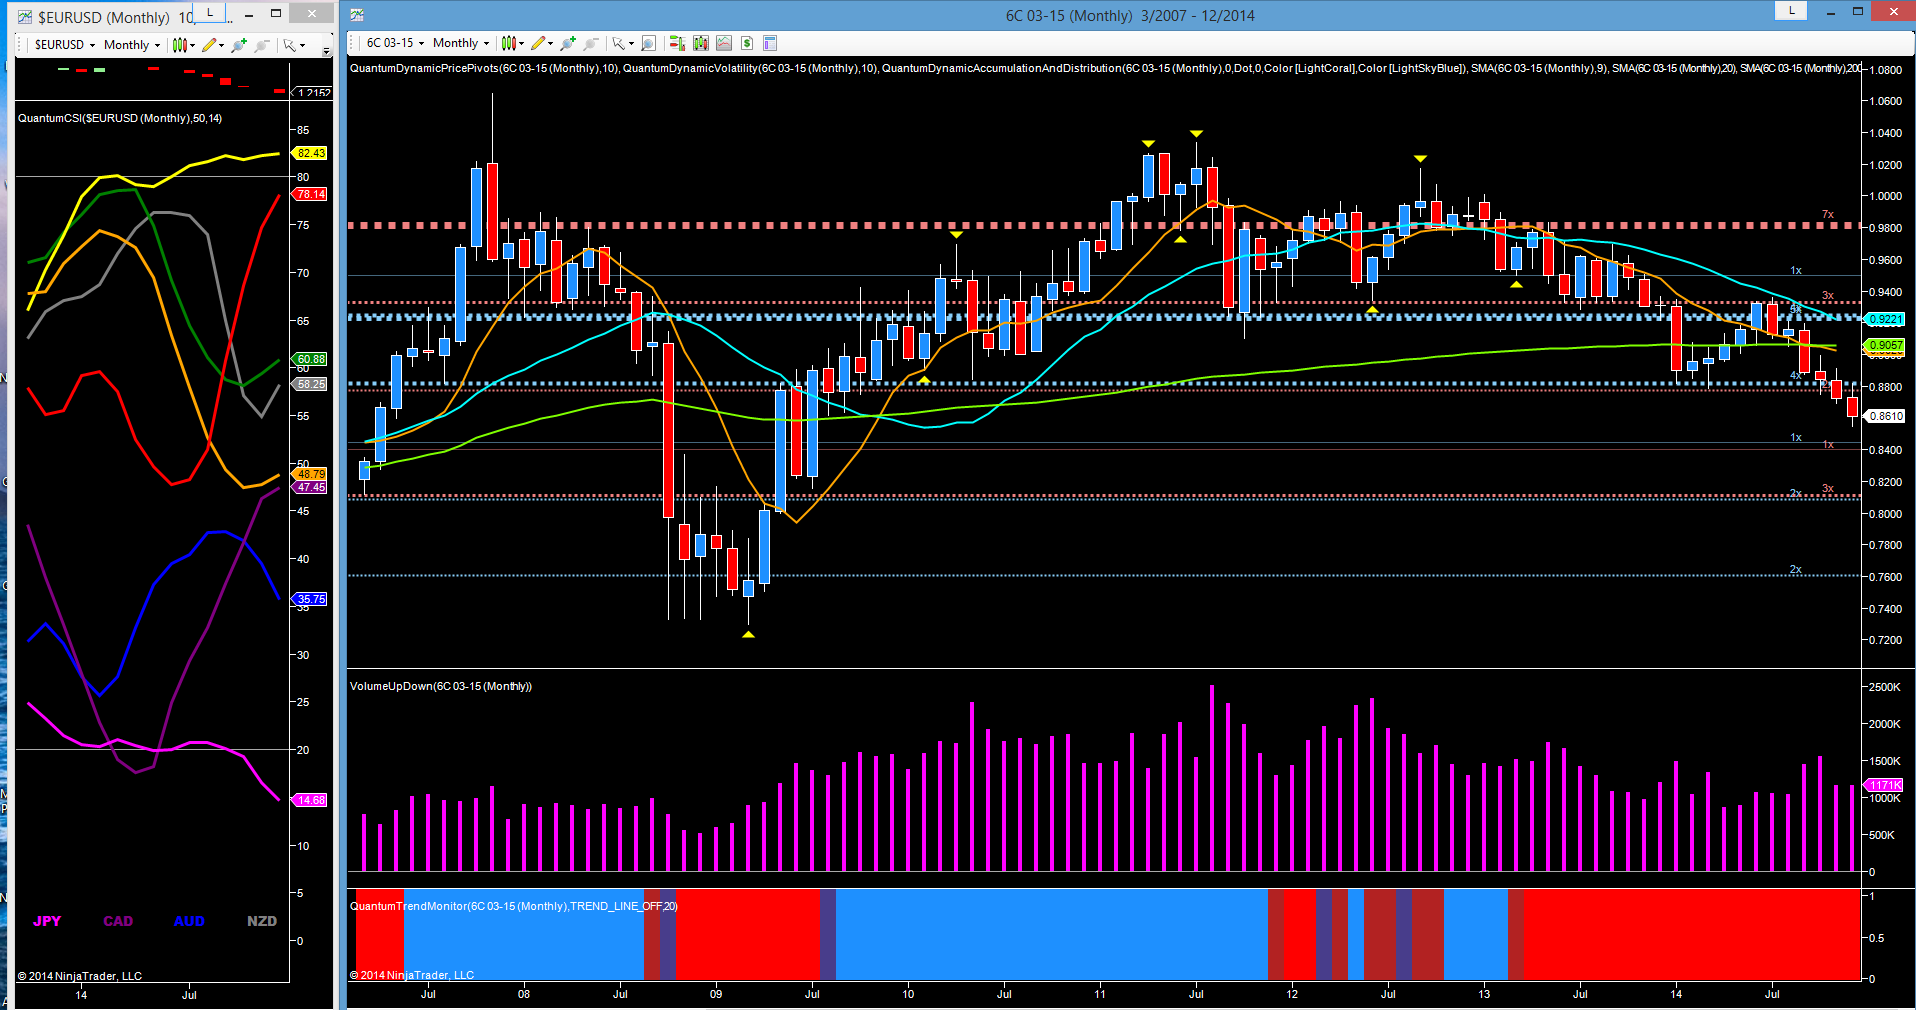
With a glut of over supply, weak demand and increasing output from shales and sands, the outlook for oil remains very weak, and in the new year prices for WTI look set to fall below $50 per barrel and on towards the low 40’s in due course. The negative sentiment has been reflected in the Canadian dollar which has fallen from the highs of mid summer in the 0.9360 region to currently trade at 0.8608 at the time of writing. Whilst oil prices have certainly been one of the drivers for the pair, as with the other majors the US dollar too has also played its part, and once again the two forces are combining strongly. The key price support region here was in the 0.8800, an area duly broken in November, and with little in the way of sustained potential support locally, the next logical target for the pair is in the 0.8100 where a deeper potential platform awaits of both accumulation and distribution. The outlook for the pair in 2015 remains very bearish, with both oil and the US dollar acting in concert with a 400 to 500 pip fall likely in Q1.


