With the FOMC now in sharp focus, and tomorrow’s key vote on a break up of the United Kingdom now looming, it’s perhaps a good time to consider four of our primary currency futures, the AUD/USD, the GBP/USD, the EUR/USD and finally the CAD/USD, all based on the daily chart for the December futures contract.
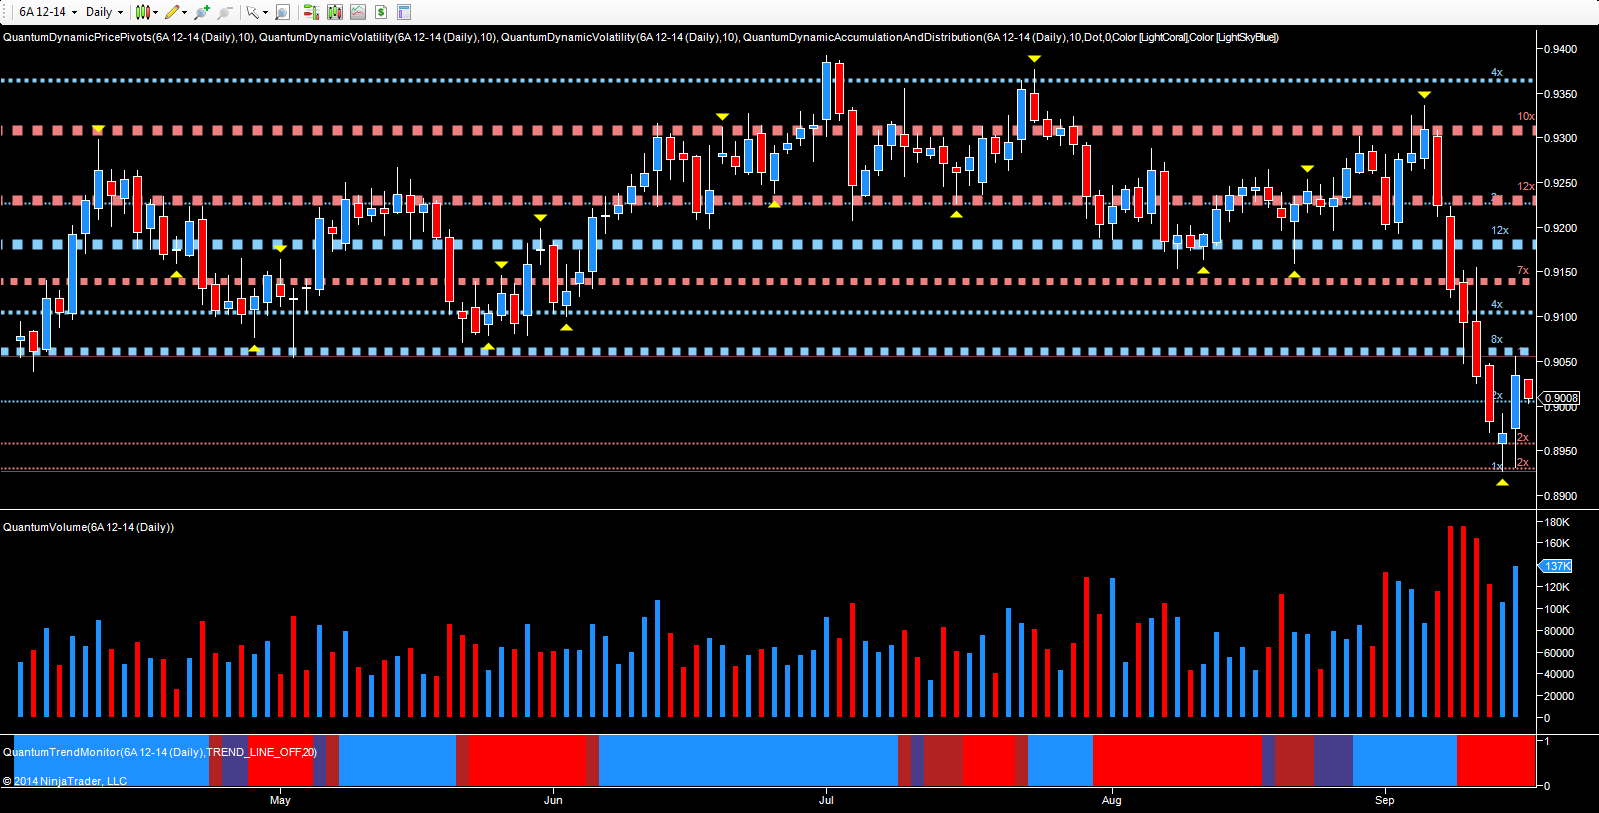
If we start with the first of these, the Aussie dollar, the pair have finally found some support this week, following last week’s plunge lower, which saw the pair collapse from the 0.9300 high down to close on Friday at 0.8983. Monday’s price action suggested a short term reversal with a long legged doji candle on good volume, duly confirmed on Tuesday with the wide spread up candle testing the resistance level above in the 0.9060 region that duly held, and further confirmed with the pivot low. Yesterday’s candle was supported with well above average volume, but given the heavily bearish sentiment longer term, this may simply be a short term reversal, and indeed in overnight trading on Globex, the pair have moved marginally lower once more to test the psychological 0.9000 region once again. Any move below the 0.8920 area will open the way to a deeper move lower and down to test a more sustained level of potential support in the 0.8740 area.

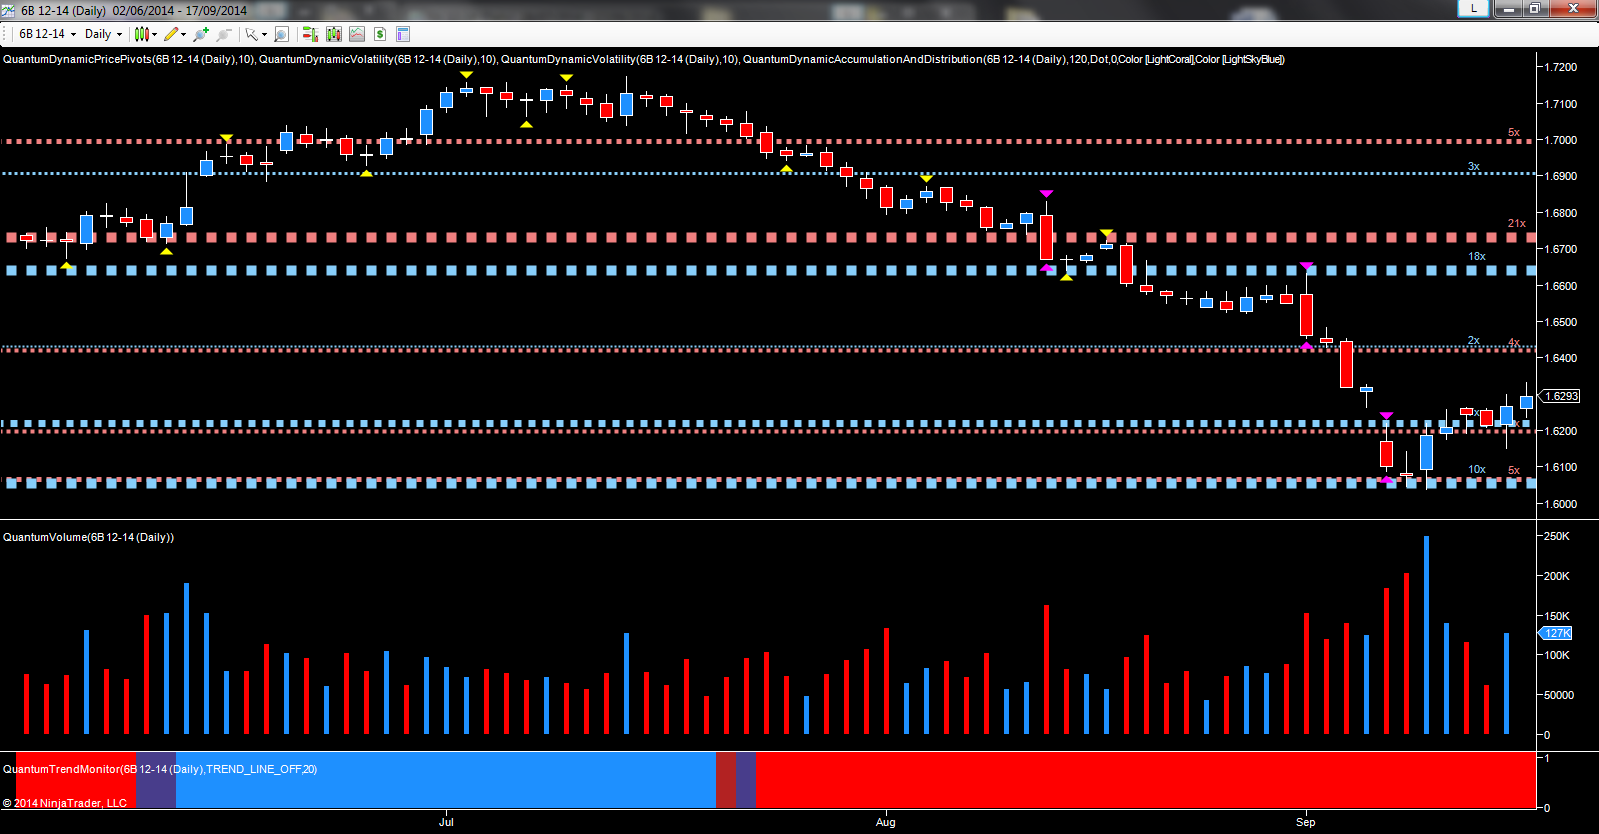
Moving to the British pound, tomorrow is of course D day or Decision Day! However, if you believe what you read in the press, one of the largest online betting companies (Betfair) has allegedly already paid out on a no vote – so make of that what you will. The consensus view is that tomorrow will indeed deliver a no, and if so, the British pound may breathe a sign of relief, counterbalanced by the FOMC this evening. Whatever happens, it will be a volatile couple of days, with price action spiking back and forth. My own analysis, suggests that Cable will indeed recover and move higher, primarily for two reasons. First, the selling pressure of last week appears to have dissipated, with Friday’s candle suggesting a test of supply, and validated in Monday’s trading session on very low volume. Yesterday’s price action held firm, balanced on the accumulation region in the 1.6220 area, and with the pair now climbing higher to trade at 1.6293 at the time of writing, some bullish momentum is returning. Finally, the COT data suggests that despite the shock gap down triggered by the result of a possible yes vote, large speculators remain net long, but it will be interesting to see is this remains the case come Friday night!

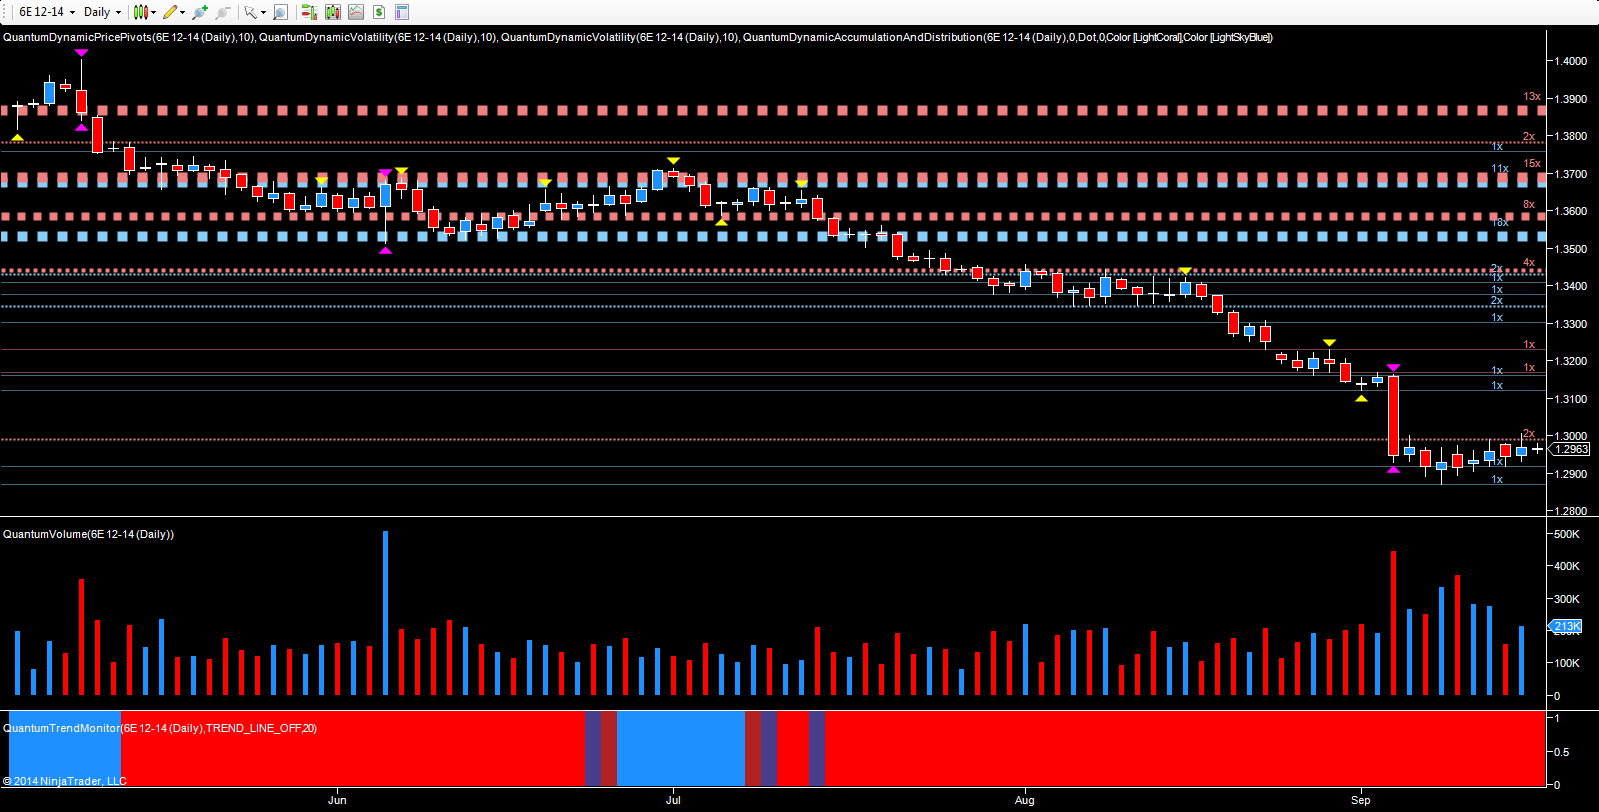
The dear old euro meanwhile remains forgotten and sulking as Sterling takes centre stage, meandering along in a narrow range. What is perhaps interesting here too, is that just like the GBP/USD, the selling pressure of the last few weeks appears to be evaporating. In particular the candle of 10th September, a narrow spread down candle on high volume was the first sign, with Monday’s narrow spread down candle on low volume, the second. With the pair currently becalmed in the 1.2963 region ahead of tonight’s FOMC meeting, any move through the 1.3000 area is now key, and if this level is reclaimed in due course, then a further modest move higher to test the 1.3120 area in due course would not be a surprise. Tomorrow sees the launch of one of Draghi’s bazookas, the much vaunted TLTRO – a catchy title, standing for Targetted Long Term Refinancing Option ( and an even longer name!) It’s a liquidity scheme, an asset purchase plan, in other words their own version of QE. If it goes to plan, and perhaps more importantly if it taken up, it will weaken the euro further. However it is in two phases with a follow up in December so it will be interesting to watch as the first salvo is fired tomorrow.

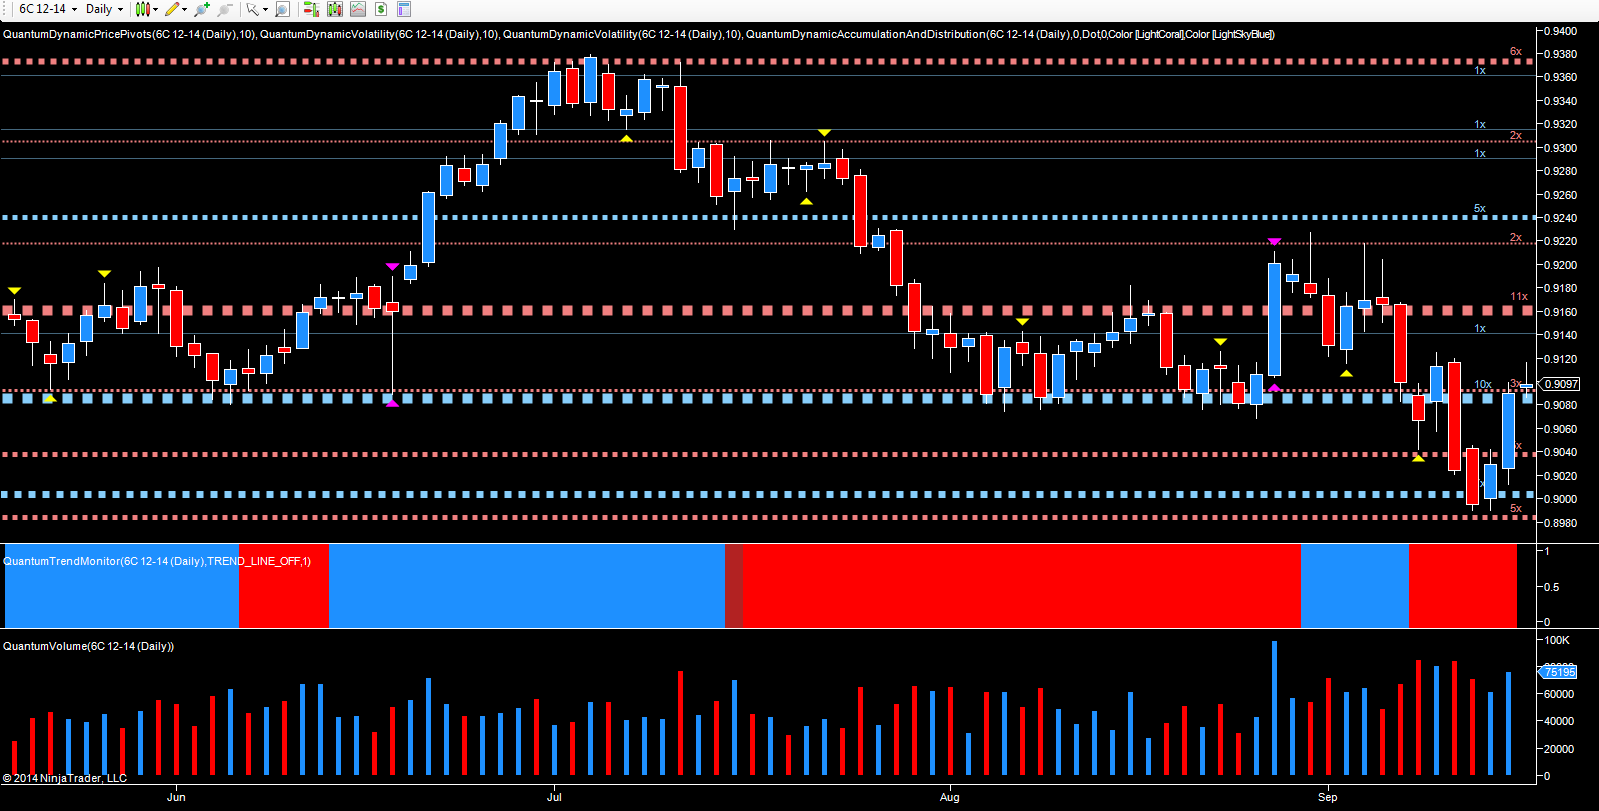
Finally we move to the CAD/USD which has recently recovered some bullish momentum following the heavy selling pressure from a resurgent US dollar, which saw the pair fall from the resistance level at 0.9380, down to potential support in the 0.9000 area. The Canadian dollar itself has also suffered from the decline in oil, which has seen the commodity remain firmly bearish. However, the latest COT report has signalled a shift in sentiment for oil traders with the large speculators now increasing their net long positions, a signal for a possible rally for oil. Indeed, in yesterday’s trading session oil prices moved higher on speculation of a cut in output from Libya supported by a similar rumour from OPEC. This helped the Canadian dollar to recover from the recent slide lower, rising sharply yesterday on strong volume, and testing the underside of resistance in the 0.0909 area. Overnight and in this morning’s trading session, price action has remained tight, with the pair trading in a 30 pip range ahead of the FOMC. If today’s price action holds above the 0.9100 region, then we could see further gains supported by moves in oil, and if so then the next logical target becomes the 0.9160 area where further resistance awaits.
