Will The Russell Soon Reverse?

Published 05/06/2016, 01:00 PM
Updated 05/14/2017, 06:45 AM
US2000
-

The Russell 2000 pulled the broad market out of the depths of February. It continued higher until reaching a peak 2 weeks ago. Since then it hasn't had such a good ride. It has fallen a little less than 5%, which isn't a huge pullback given the 22% rise that preceded it. The real question is, will it continue to fall or will it soon reverse?

The chart below shows two overlapping patterns that suggest the downside is not over yet. The yellow pattern is a Cup and Handle. The Cup has been built, with Handle representing the pullback. If the Russell 2000 is simply digesting, then it should not fall below the 105 area.
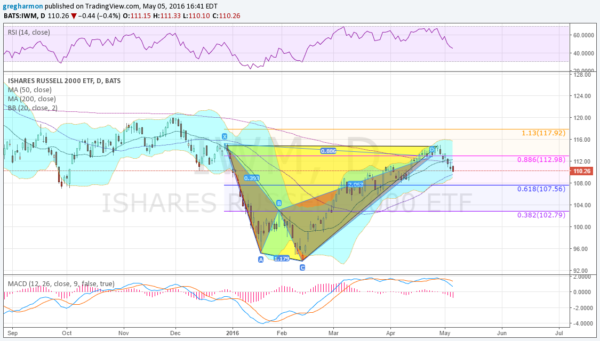
iShares Russell 2000

The two orange triangles represent a bearish harmonic Shark pattern, which reached its Potential Reversal Zone (PRZ) 2 weeks ago and triggered to the downside. The first target would be a 38.2% retracement of the pattern -- or to 107.56. Failure there would target 102.79.

Both of these patterns look for more downside and momentum supports that too. The RSI and MACD are both falling. But both also remain in bullish ranges. The Bollinger Bands® are pointing higher and price is near the bottom band. The 50-day SMA close by may also be an area to attract buyers.

For now, the Russell is in limbo. A move under the 50-day and lower Bollinger Band at about 109 would add weight to the extended downside. A stall and reversal before breaking 107.5 would add weight to the case for it just digesting the long run higher and prepping for the next leg up.

Latest comments

Loading next article…
Risk Disclosure: Trading in financial instruments and/or cryptocurrencies involves high risks including the risk of losing some, or all, of your investment amount, and may not be suitable for all investors. Prices of cryptocurrencies are extremely volatile and may be affected by external factors such as financial, regulatory or political events. Trading on margin increases the financial risks.
Before deciding to trade in financial instrument or cryptocurrencies you should be fully informed of the risks and costs associated with trading the financial markets, carefully consider your investment objectives, level of experience, and risk appetite, and seek professional advice where needed.
Fusion Media would like to remind you that the data contained in this website is not necessarily real-time nor accurate. The data and prices on the website are not necessarily provided by any market or exchange, but may be provided by market makers, and so prices may not be accurate and may differ from the actual price at any given market, meaning prices are indicative and not appropriate for trading purposes. Fusion Media and any provider of the data contained in this website will not accept liability for any loss or damage as a result of your trading, or your reliance on the information contained within this website.
It is prohibited to use, store, reproduce, display, modify, transmit or distribute the data contained in this website without the explicit prior written permission of Fusion Media and/or the data provider. All intellectual property rights are reserved by the providers and/or the exchange providing the data contained in this website.
Fusion Media may be compensated by the advertisers that appear on the website, based on your interaction with the advertisements or advertisers.
© 2007-2025 - Fusion Media Limited. All Rights Reserved.