The transportation sector has refused to join the other indexes in reaching new all-time highs this year. Many aspects have looked ready to break higher, including trucking and delivery stocks, but have failed to do so. The railroads have also looked ready to move higher and some have done that. One more data point in that series comes out tonight as CSX (NASDAQ:CSX) reports earnings.
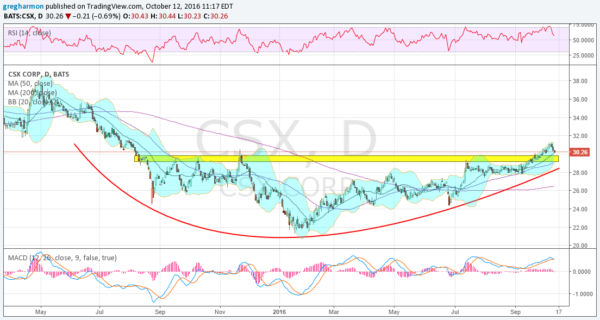
CSX stock made a high near 38 in May last year. From there it ran lower to an ultimate low near 22 in January, a drop of over 40%. But since that low it has slowly drifted higher with a series of higher lows and higher highs. It is called rounding out a bottom. There has not been any major run, just chugging along higher with some short term pullbacks along the way. But the story keeps looking brighter.
In April it moved back over its 200 day SMA for the first time in 10 months and after some back and forth the 50 day SMA crossed up through the 200 day in May. Following that Golden Cross the price has remained over the 200 day SMA ever since. In September it moved up over a resistance range that had caused trouble in late 2015 and then again in July. Into earnings it is pulling back towards that range.

The short term question will be whether or not it holds as support. The momentum indicators are shifting to the downside short term with the MACD about to cross down and the RSI pulling back from a technically overbought condition. The path following the report seems easiest to the downside.
The October options chain shows the at-the-money straddle looking for a $1.40 move (4.6%) by expiry next Friday. That would make for a range of 28.90 to 31.70. The lower end of that range is right back at the bottom of the resistance zone discussed above. Open interest is focused from 29 to 32, and biggest on the call side by a factor of 3. Short interest is low at less than 2%.
If you are compelled to own this stock on its reversal, the earnings event may give an excellent opportunity to get in at a sub market price. Buying an October 30/29 1×2 Put Spread at a credit of 6 cents gives participation on a move lower to 29 and if it closes under 29 at expiry an entry there, but with a basis of 28.
That is right at the July through August base support. If you cannot do a 1×2 Put Spread then a 30/29/28 Put Butterfly accomplishes the same thing and only costs 15 cents. This one also gives protection should there be a big problem and the stock falls precipitously.
Another way to trade for a longer term upside gain is to use a Call Calendar. An October/January 32 Call Calendar for 65 cents looks for the large open interest and options implied price move to hold the stock under 32 next week, then to continue higher over time.
DISCLAIMER: The information in this blog post represents my own opinions and does not contain a recommendation for any particular security or investment. I or my affiliates may hold positions or other interests in securities mentioned in the Blog, please see my Disclaimer page for my full disclaimer.
