A bitcoin turning point in most cases isn’t evolving from a down to up price movement. There is a sideways period, an entry zone rather than a specific price. Prices meander around for a period of time. It is obvious that, just because a certain price level has been hit, does not mean it is a good time to enter a trade. Unfortunately this is the most common methodology applied to the market.
How To Improve High Probability Turning Point Entry Timing
There is one rule of thumb:
- there are more profitable trading systems for smaller time frames, which use early entries (at the beginning of the sideways period).
- and there are more profitable trading systems for larger time frames, which use late entries (at the end of the sideways period).

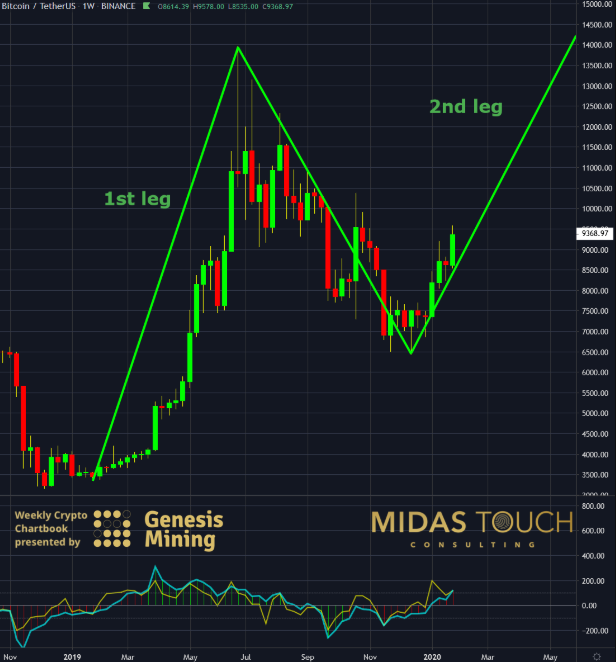
BTC/USDT weekly chart as of January 31, 2020
Second legs are more often than not the longest in duration and length. Length meaning price extension. Many larger time frame players enter a trade, if the time frame below their exposure time frame has a confirmed second leg entry.

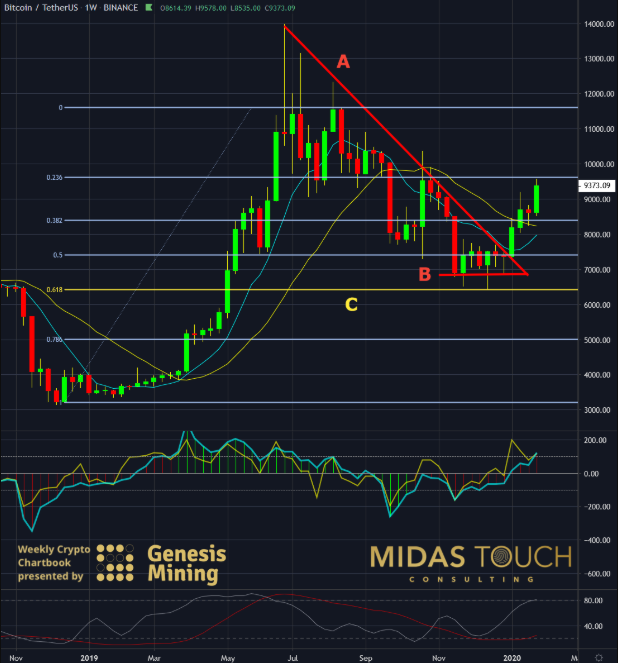
BTC/USDT weekly chart as of January 31, 2020
The weekly chart above shows a breakout through the directional resistance trend line (A), which now has become support. It also illustrates the seven weeks support building base (B) near the US$7,000 zone. This support is cemented in addition by the double bottom spikes to the 0.618 fibonacci retracement level (C). Representing another layer of a supply and demand zone.

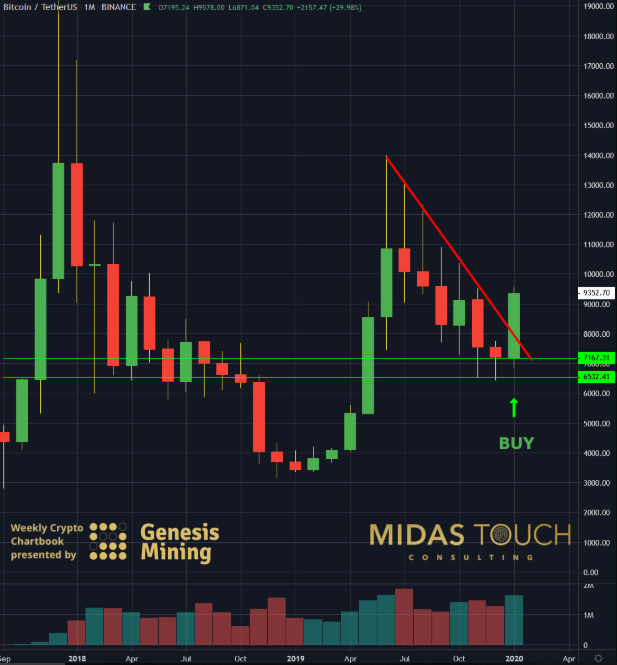
BTC/USDT monthly chart as of January 31, 2020
With this month ending, charts show confirmation for a higher time frame long trade opportunity. If you trade higher time frames, trade longer term futures or use a cloud mining service, the first week of the month of February provides entry opportunity.
Turning Point Entry Timing
There is no need to be the first who is pushing the entry execution button, if you are trading higher time frames. Just because the market hits a certain price level, does not mean it is the best time to enter. Quite the contrary, for longer term players the odds stack in favor waiting for prices to go slightly higher after the typical preceding sideways trading period.
