
Here at Midas Touch Consulting risk control is our foremost goal. This requires endless hours of backward and forward testing of each individual market, sector, instrument and timeframe to stack the odds as best as possible and extract trading principles that allow for best trading results. In our chartbook from May 4th we posted the following two charts to anticipate entries for Bitcoin. Both scenarios worked out perfectly and we posted the entries and exits live in our free Telegram channel. Low-risk precision trading is possible if one does the homework.
BTC-USDT, Daily Chart From May 4th Chartbook (First Setup):
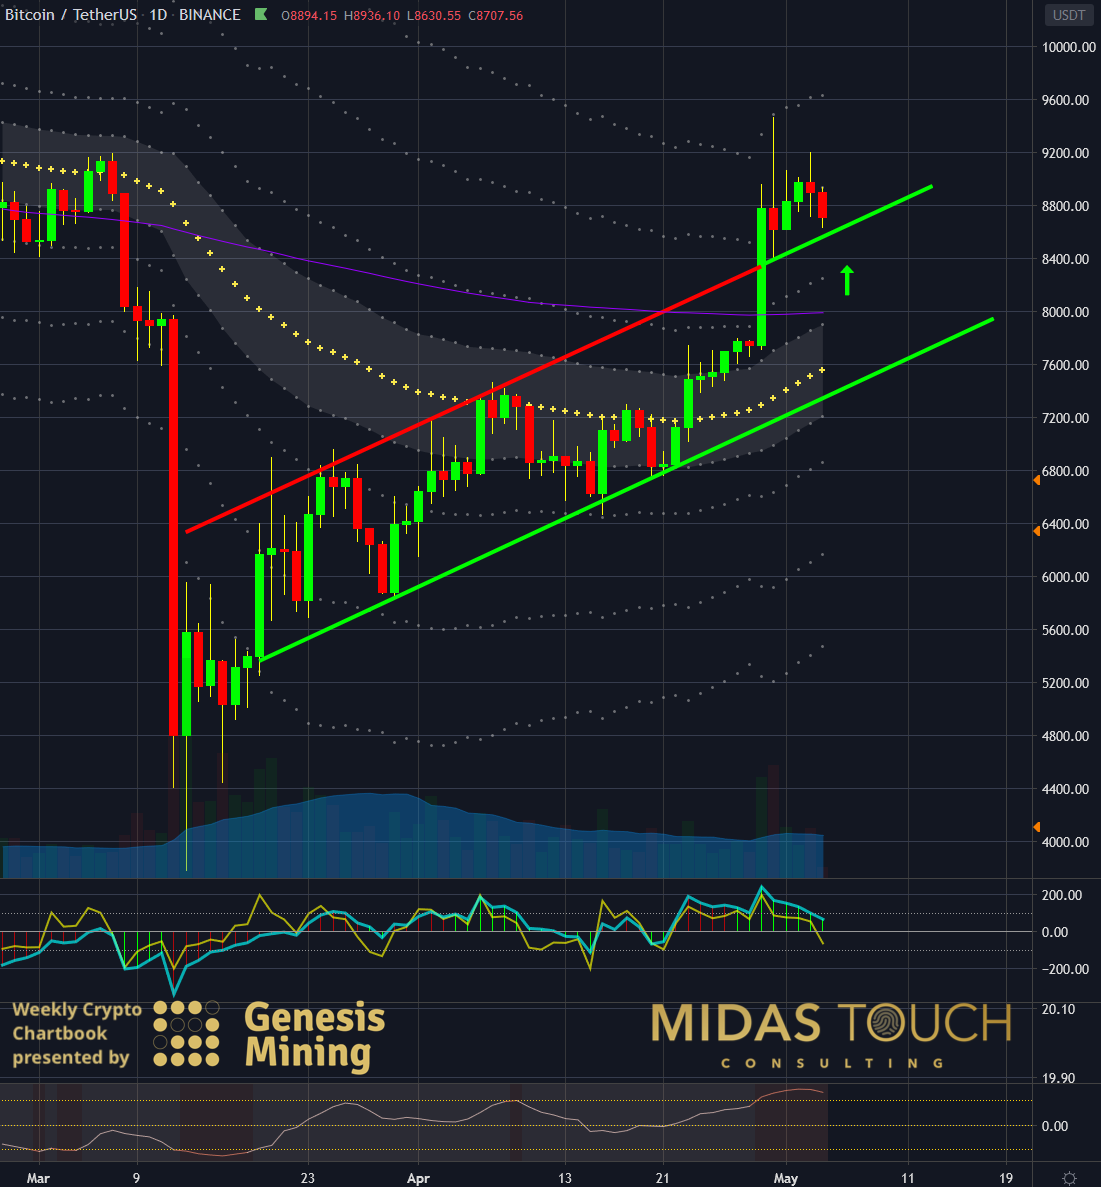
BTC-USDT, daily chart as of May 4, 2020.
This was our setup at the time anticipating an entry on the upper channel line.
BTC-USDT, Daily Chart From May 8, Precise Low Risk Entry:

BTC-USDT, daily chart as of May 8, 2020.
Shortly after publication of the chartbook from May 4 prices reached precisely the upper channel line. We posted this entry in real time into our Telegram channel. This, as well as all three exits, locked in nice profits for a reload trade. See our quad strategy for detailed exit rules and principles.
BTC-USDT, Daily Chart From May 4 Chartbook (Second Setup):
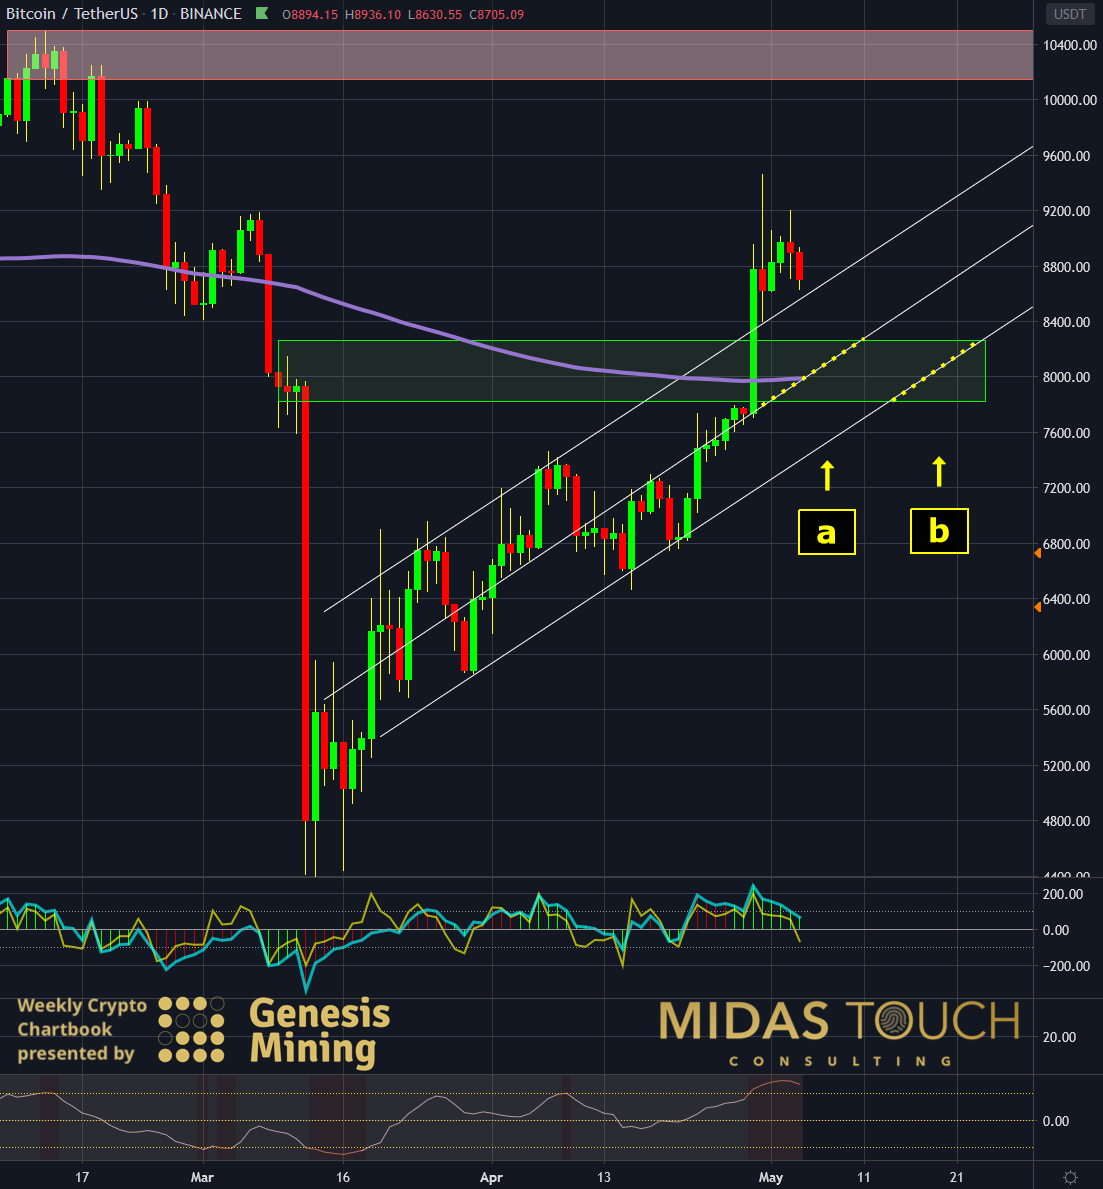
BTC-USDT, daily chart as of May 4, 2020 b
And here, the second setup shows where we were hoping for a larger retracement towards the mid channel support line.
BTC-USDT, daily chart From May 18, nailed it again:
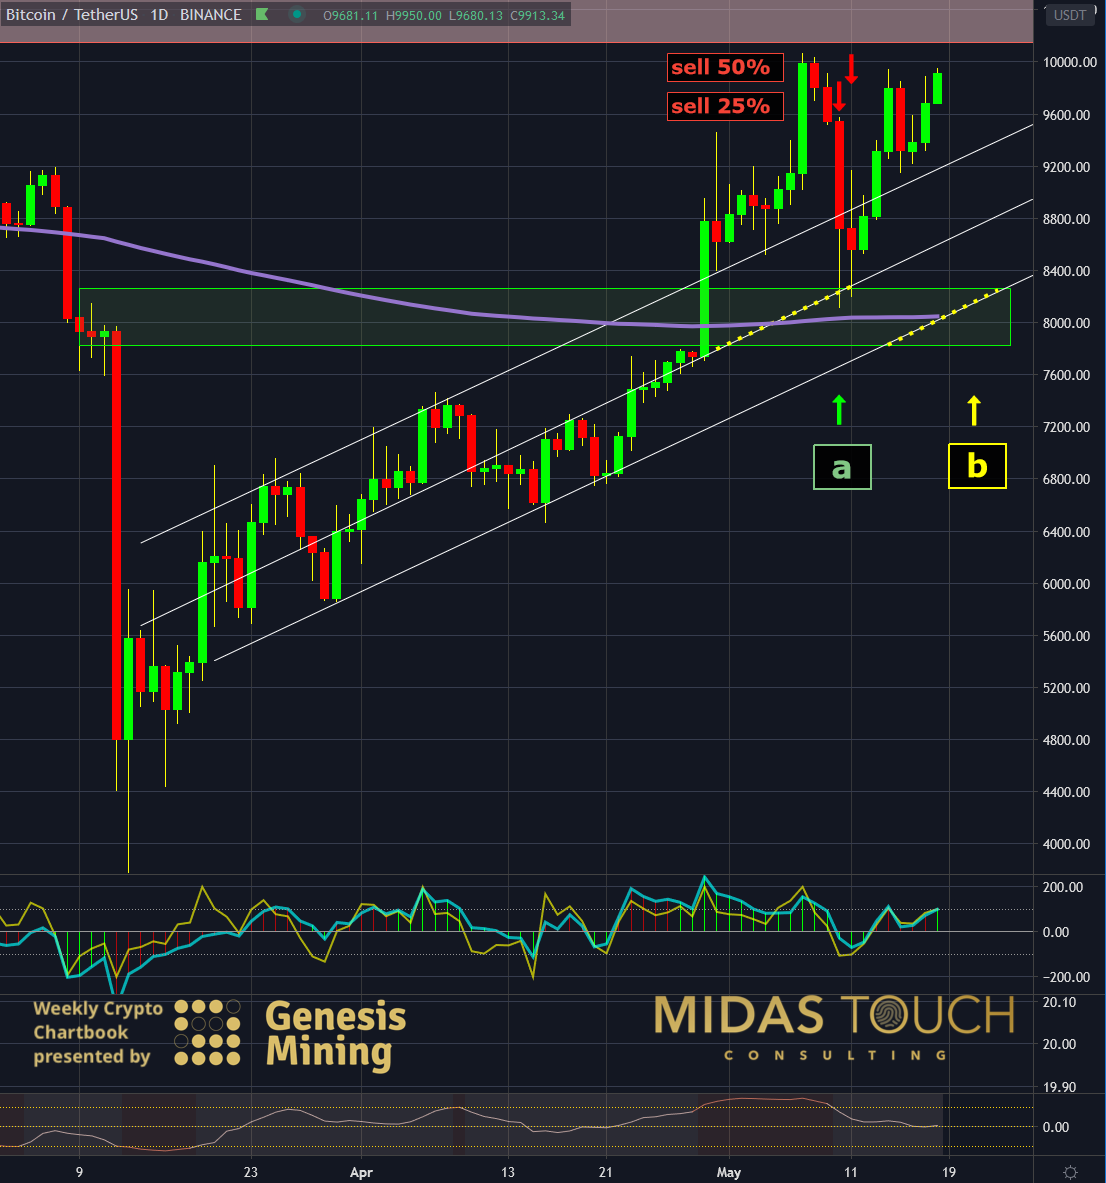
BTC-USDT, daily chart as of May 18, 2020 b.
And again, a week later, our second price forecast was fulfilled to a T. How could we know such precision a week into the future? It is typical to Bitcoin. After looking at hundreds of directional channel lines and thousands of entries, this specific setup has a higher probability than other formations in Bitcoin. Again, we were able to post these entries live in our Telegram channel. Generous profits were extracted on exceptional risk reward ratios and a portion of the trade is still exposed in the direction of the trend.